- Concentrate on fewer, more profitable trades per day.
- Document my favourite trade setups.
- Develop a multi-level watchlist (day, swing and position levels) and put more money to work.
- Plan the trade and trade the plan as opposed to taking my profit too soon.
- Enhance stops - a. don't forget the stop; and, b. make sure it is set at a strategic level.
Saturday, December 31, 2005
A Few Rules to Trade by in 2006
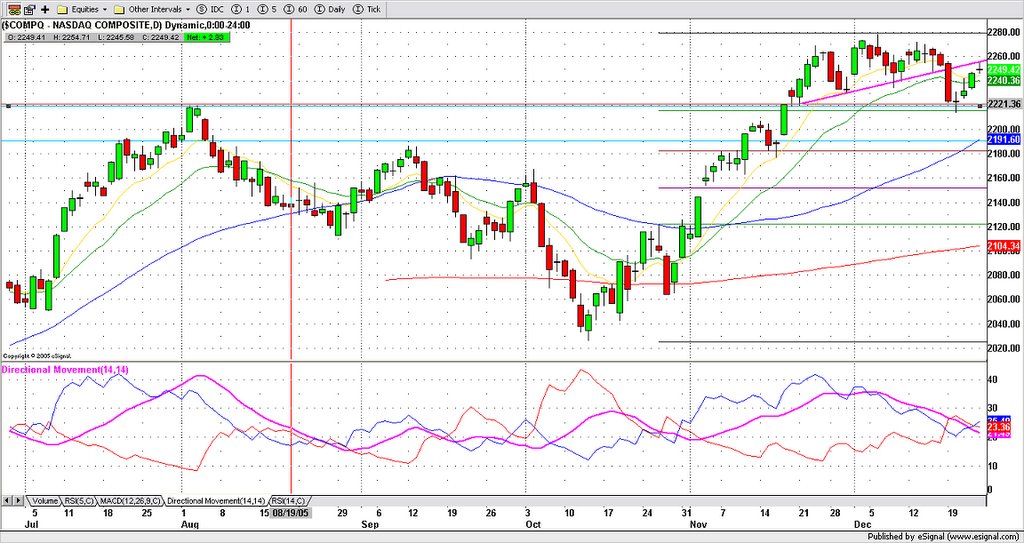
Nasdaq Technical Picture
Click on chart for larger view.
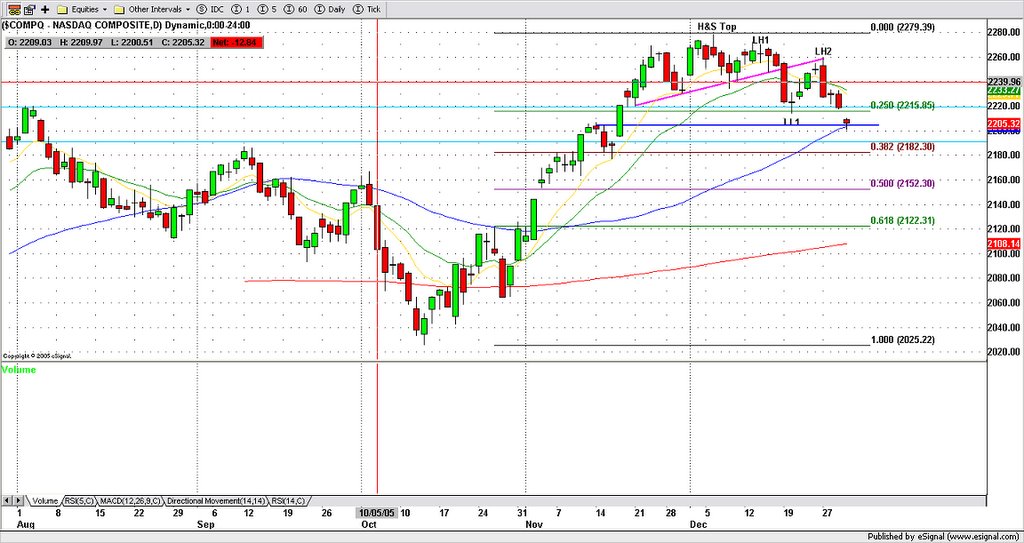
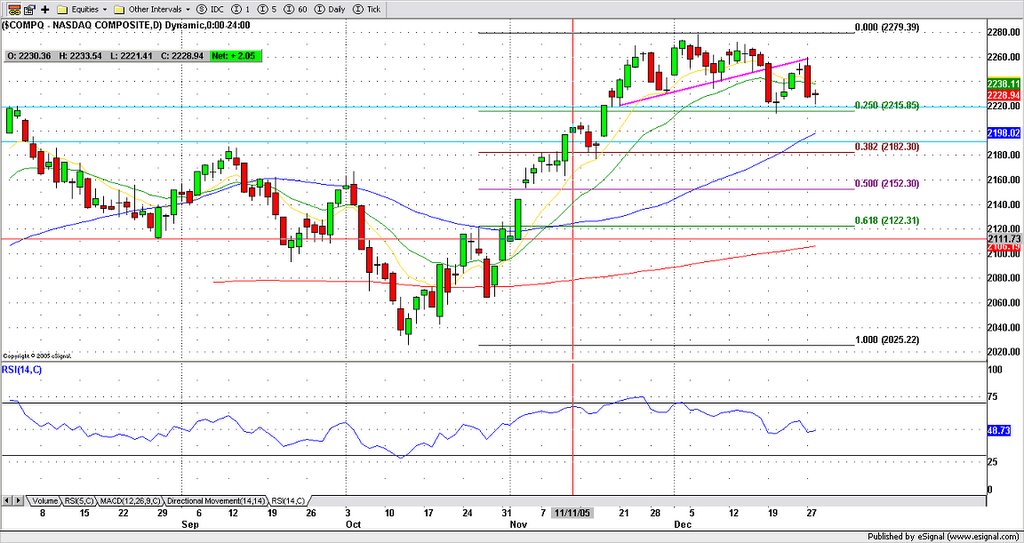
As hinted at here yesterday, the market moved lower again today, closing 2005 with a marginal gain of about 1.5%. The Nasdaq gapped down on the open and moved lower through most of the morning. A minor rally off the lows lifted the market slightly to form a small hammer just above the 50 period SMA. From the chart we can see that this area marks minor support from the mid-November high (blue segment). If today's gap down is not filled in early action next week, it will act as future resistance.
Happy new year everyone and best wishes for a very prosperous 2006 trading year!
Friday, December 30, 2005
Trade of the Day - ENER
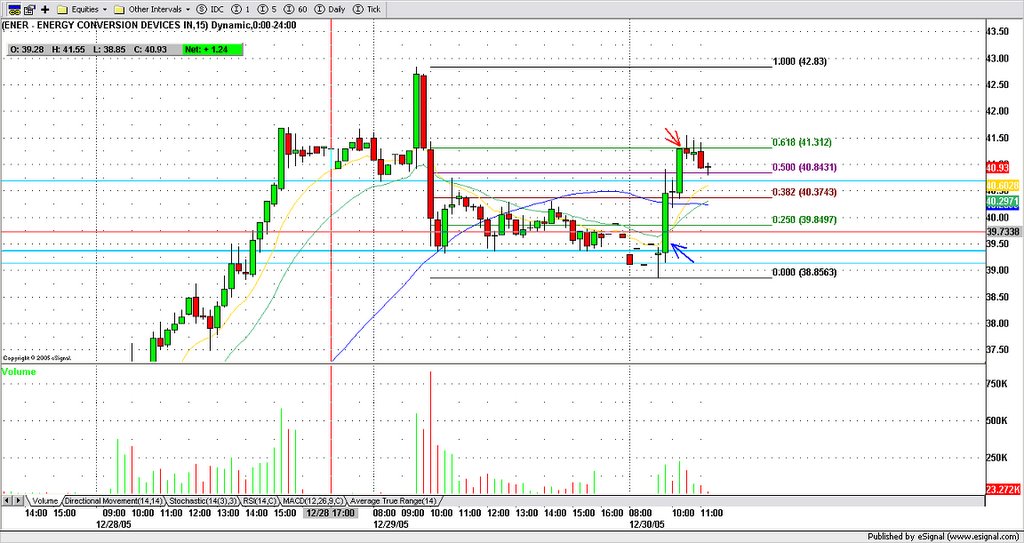
Good for a 62% retracement of yesterday's high to this morning's opening hammer bar on the 15 minute chart. The trade was taken as price passed above yesterday's afternoon support which was now resistance.
Thursday, December 29, 2005
Nasdaq Technical Picture
Click on chart for larger view
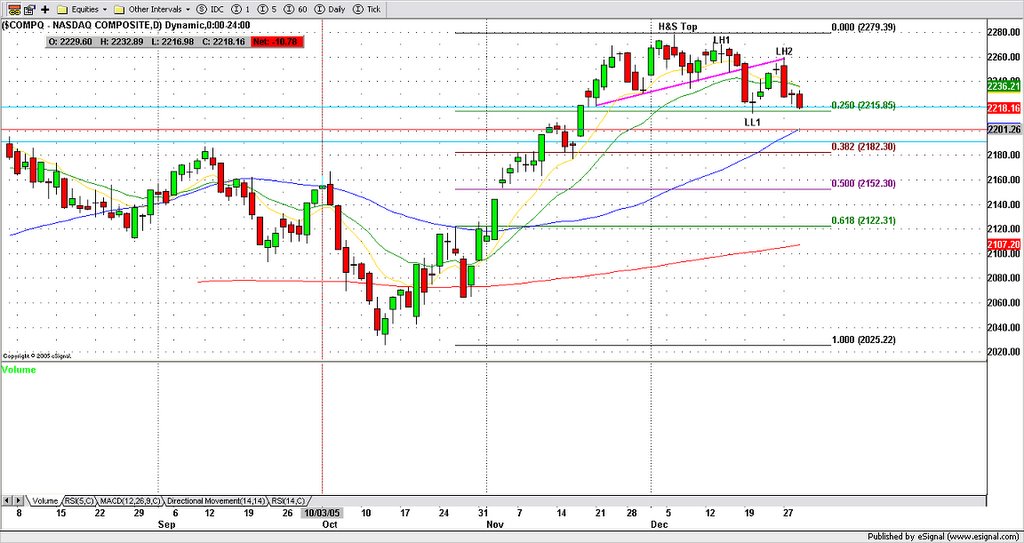
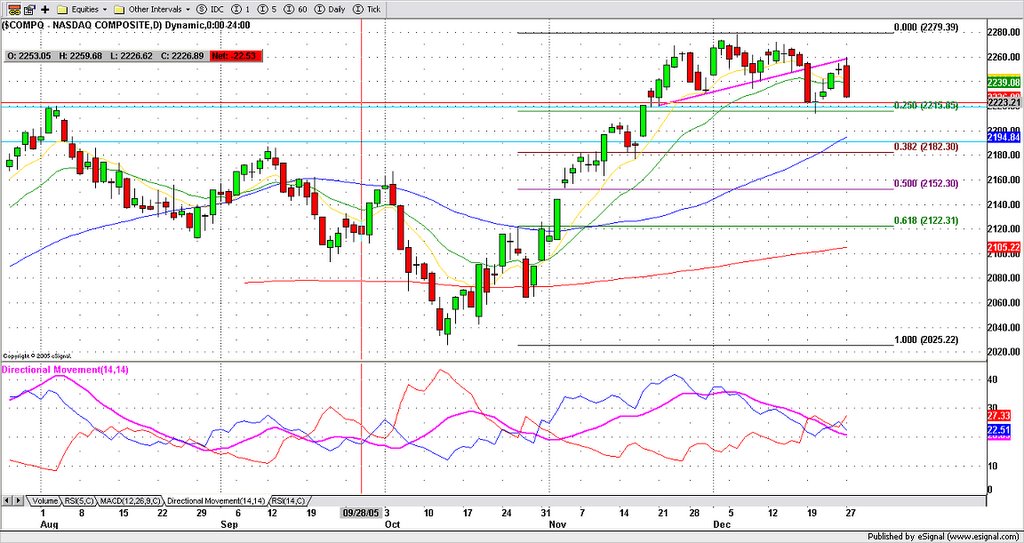
Today's trading resulted in a close just a touch below the 2219 pivot point which has been in play since mid November. The Nasdaq fell in late afternoon trade due, according to some, to lack of institutional participation in this holiday week.
If the market closes below LL1 tomorrow we can expect a measured move lower from the H&S Top in the 32% retracement area of the October - Novemeber rally. This could be positive for the market overall if the pullback occurs in an orderly fashion.
LH designates a lower high and LL designates a lower low. Since early December the Nasdaq has carved out two lower highs and one lower low the latter of which could be taken out shortly.
Bad Trade - ENER
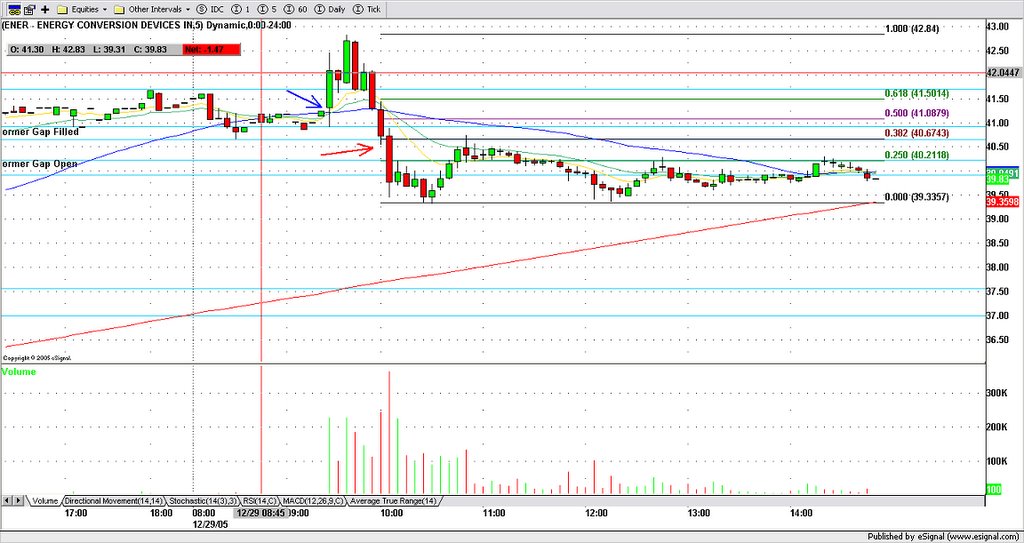
Lesson Learned
Keep a tight stop when taking a position in momentum stocks on the open.
Watch List
ENER - closed on its highs yesterday
MEDX - Still a momentum play but I expect an intraday pullback after such a nice run
ADBE - Yesterday's doji could setup a bullish reversal
BOOM - pullback to gap support
CEPH/ALKS - Story stocks and CEPH momentum
MFLX/MOT - Story stocks on incr. guidance
PALM - Consolidation after gap up
MEDX - Still a momentum play but I expect an intraday pullback after such a nice run
ADBE - Yesterday's doji could setup a bullish reversal
BOOM - pullback to gap support
CEPH/ALKS - Story stocks and CEPH momentum
MFLX/MOT - Story stocks on incr. guidance
PALM - Consolidation after gap up
Pre-market Action - Top trade Counts
ALKS - FDA Vivitrol - currently trading at $18.80, next resistance level is the November high $19.87
QDEL - Influenza
CELG - Story Stock
QDEL - Influenza
CELG - Story Stock
Wednesday, December 28, 2005
Nasdaq Technical Picture
Today's action resulted in a narrow range hammer like candle which held support in the 2221 area. In candlestick charting, the hammer is usually a reversal signal.
Trade of the Day - ENER
Click on Chart for larger view
How and Why was the Trade Executed
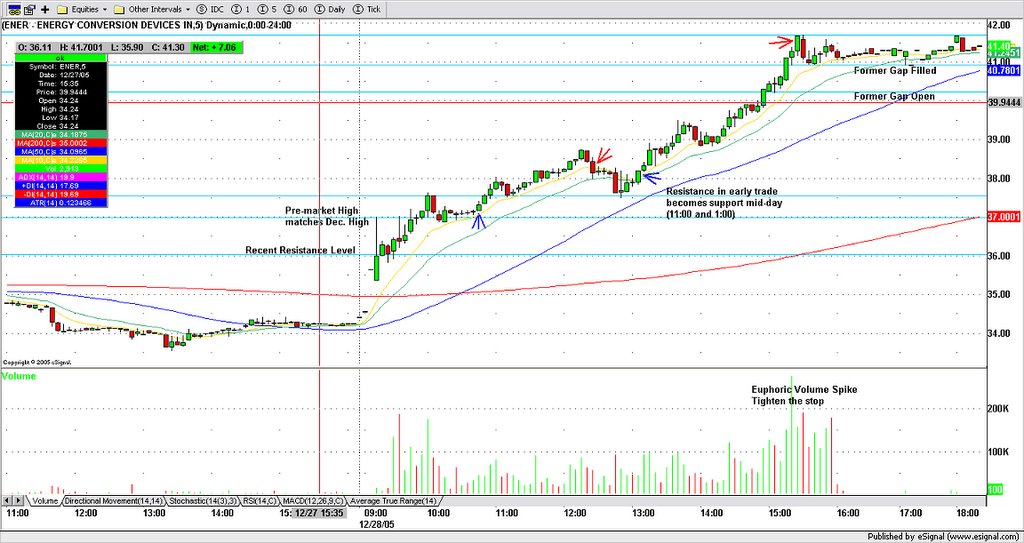
ENER was identified as an important pre-market mover based on the trade count level. The next step was to identify and map existing support and resistance levels from the daily chart view. These are identified in light blue on the chart above.
The next thing to do is check Briefing.com or a similar service for news on the stock to determine if it has potential beyond the pre-market action. Unfortunately, Briefing missed this one until later in the day.
The next step is to see how it moves just after the open. ENER observed recent resistance as support which was a positive sign. It was now safe to enter a position. I waited for a good setup because I didn't want to buy it too far above its 10 period EMA on the five minute chart.
Shortly after 10:00 the stock had a shallow pullback in which it observed the December high as support. As the stock lifted from its narrow consolidation, a position was entered (blue arrow).
The position was stopped out during lunch and re-entered shortly after 1:00 as the stock crossed above the 10 period EMA. The late afternoon euphoric volume spike foreshadowed the end of the party and the stop was tightened.
N.B. - ENER closed very near the high of the day, so keep this one on your radar tomorrow morning.
Pre-market Action - Top trade Counts
CELG - FDA approval of Revlimid. Closed yesterday at $57.48 and currently trading at $60.20. Resistance levels are the December high $62.50 and November high $63.27
AFFX, ENER, CALM, EBAY, RGEN
AFFX, ENER, CALM, EBAY, RGEN
Watch List
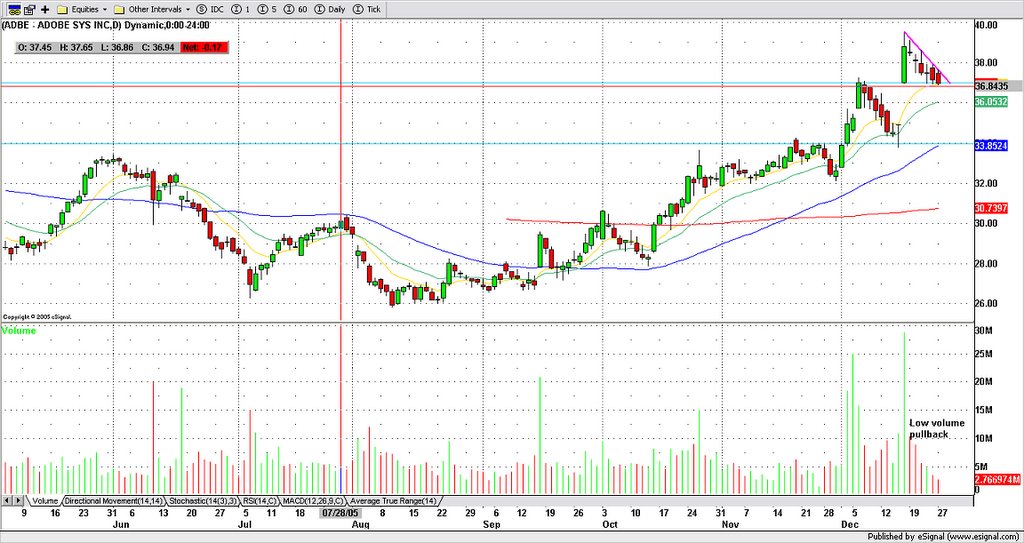 ADBE gapped up on earnings two weeks ago and has since pulled back to gap support on low volume. Could be in play if gap support holds.
 MEDX - Momentum stock from high volume breakout two weeks ago.
Support $13.00
Resistance $17.00
Close Tuesday $13.42
Nasdaq Technical Picture
 After gapping up and reaching the extension of its H&S neckline in early trade, the Nasdaq went on to shed 22.5 points carving out an ominous looking bearish engulfing pattern. The next major support level is 2219 which lines up with the doji morning star reversal from last week. The Nasdaq closed on its low so expect a weak open in the morning.
Tuesday, December 27, 2005
Trade of the Day - BOOM
 Click on Chart for larger view.
 Blue arrows represent buy orders, red arrows represent sell orders and the black arrow represents a missed buy order.
BOOM was flagged in the pre-market as a possible momentum trade.
How and Why was the trade executed?
Boom was trading up in the pre-market. A review of the daily chart showed that if the stock gapped higher, it could make a run for the recent highs set in early and mid December. These two highs were marked on the chart (blue lines) as targets.
Minutes before the open a buy stop order was placed ($31.30) 5 cents above the pre-market high. As the trade got underway, a stop was placed 5 cents below the 10 period EMA on the 5 minute chart. The stop was moved up as the EMA moved up.
The stock consolidated briefly at the first target marked by the most recent daily high and proceeded to make a run for the all time high. The entire position was sold when the this second target was attained ($32.20) because the market as whole (NASDAQ) felt weak at this point.
As the price moved back towards the first target in an orderly fashion, a buy order was placed at $31.80. As this second trade got underway, a tight stop was placed in order to avoid too much give back from the first trade. The trade was eventually stopped out at $32.50.
After retracing all of the morning's open market gains, the stock could have been repurchased in the area marked by the black arrow for a 50% retracement of the morning play.
The first trade netted 0.90 (before commissions) and the second trade netted 0.70.
It is important to determine and flag the target areas before the trade is executed. Always expect some consolidation when price moves into the target areas. If the price activity becomes sloppy in the consolidation area, tighten the stop in order to avoid giving too much profit back.
Momentum
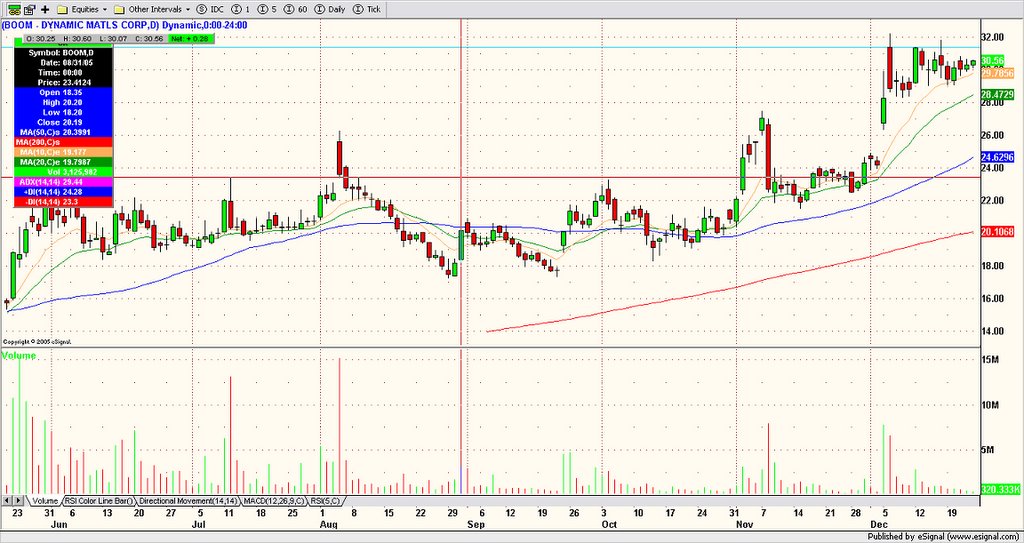
BOOM is trading up in pre-market. This name has a nice daily chart and could be ready to spring again soon.
Nasdaq Technical Picture
 Head and Soulders Top followed by a doji morning star at the critical 2219 support level. Which reversal pattern will prevail?
Pre-market Action - Top trade Counts
NEOL - far away the highest trade count, up 44% from the close, STAA, TASR, NMGC, RACK (Cramer), plus the usual suspects, AAPL, SNDK, SIRI on strong northeast Xmas sales, BBBY upgrade, AMZN best Xmas ever.
MEDI, PETS
MEDI, PETS
Friday, December 23, 2005
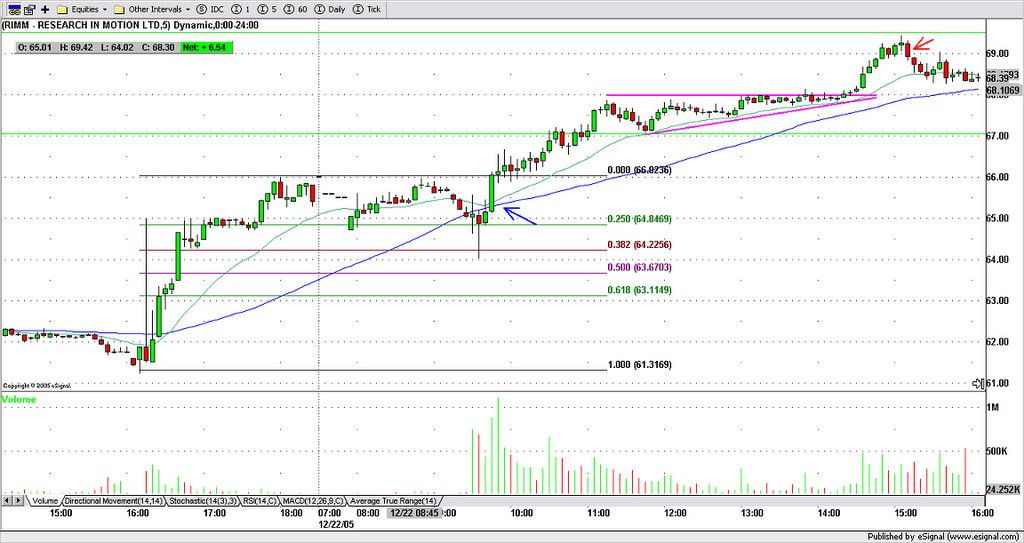
Thursday, December 22, 2005
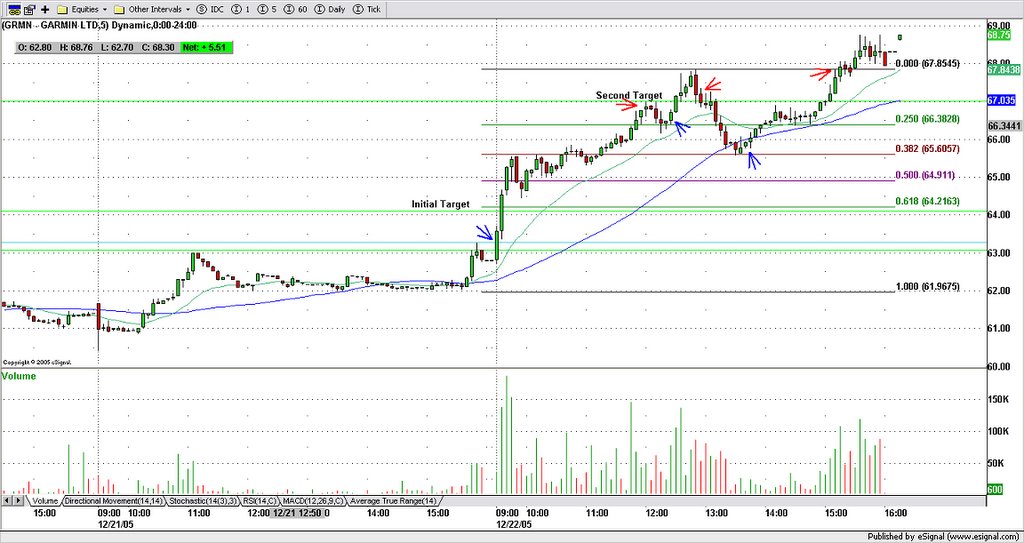
Trade of the Day
GRMN closed near the high of the day yesterday displaying late day strength despite a weak afternoon market.
Setup - Buy Stop 5 cents above yesterday's high around $63.30. Initial target was set at $64.00 with a second target at $67.00. These targets match up with previous congestion areas on the daily chart over the last three months.
Blue arrows are my entry points and the red arrows are exit points.
Subscribe to:
Posts (Atom)