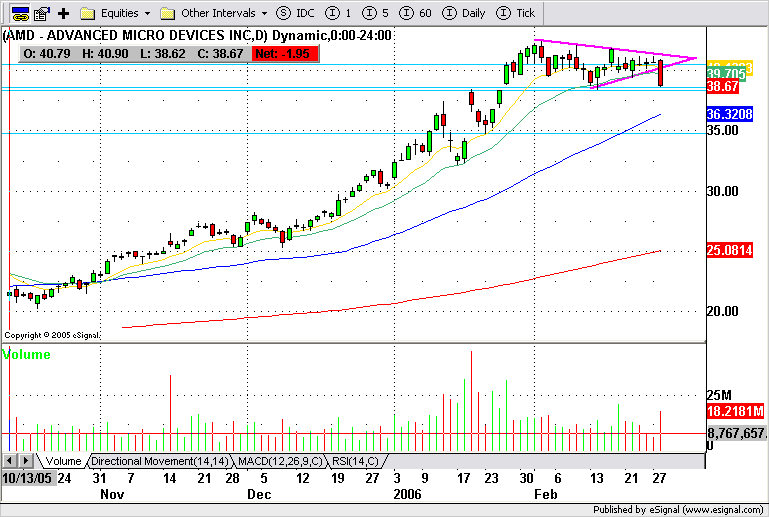
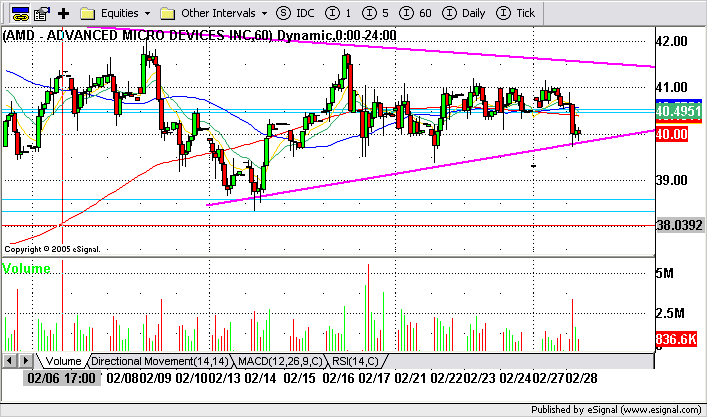
 AMD's pennant flag was violated on a closing basis on relatively high volume. Will former gap support hold tomorrow? This may be a bear trap. We'll have a better indication tomorrow. AMD is trading up about 0.30 in AH.
Tuesday, February 28, 2006
AMD - Pennant Violated
AMD's pennant flag was violated on a closing basis on relatively high volume. Will former gap support hold tomorrow? This may be a bear trap. We'll have a better indication tomorrow. AMD is trading up about 0.30 in AH.
SIRI - CBS sues Howard Stern and Sirius - Support at $5.00 may be in Jeopardy
 SIRI may be in serious trouble if the CBS lawsuit has legs. Trading slightly lower in AH on the news. Watch support at $5.00 tomorrow.
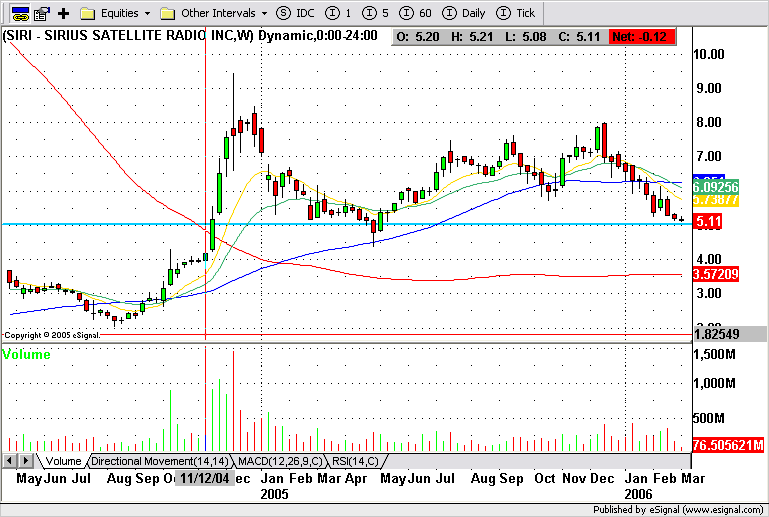
GOOG Update on CFO's Big Gaff
 GOOG has issued a press release to try to repair some of the damage from their CFO's big gaff this morning (courtesy of Briefing.com)
"Google issues press statement (GOOG) : George Reyes, Chief Financial Officer of Google Inc, participated earlier today in the Merrill Lynch Internet, Advertising, Information, & Education conference. At this conference, Mr. Reyes made remarks regarding, among other things, revenue growth trends and expected sources of revenue growth. We would like to clarify and provide further information on these statements. As we have stated before, monetization improvements will continue to be a key factor in driving future revenue growth. We still see significant opportunities to improve monetization and intend to continue to focus our efforts in this area. Moreover, as we have stated in our SEC filings, our revenue growth rate has generally declined over time and we expect that it will continue to do so as a result of the difficulty of maintaining growth rates on a percentage basis as our revenues increase to higher levels. "
For a play by play of some of George Reyes most quoted comments visit Trader Mike
Since GOOG doesn't issue much in the way of financial guidance, these comments hit the stock and the market like a ton of bricks. GOOG's analyst conference is scheduled for March 2nd so I don't understand why the CFO felt compelled to let his mouth loose today. Is this a warm-up or, more likely, a CFO lacking in street smarts?
P.S. If Google is on the market for a new CFO, I can recommend a really good candidate.
Nasdaq Technical Picture
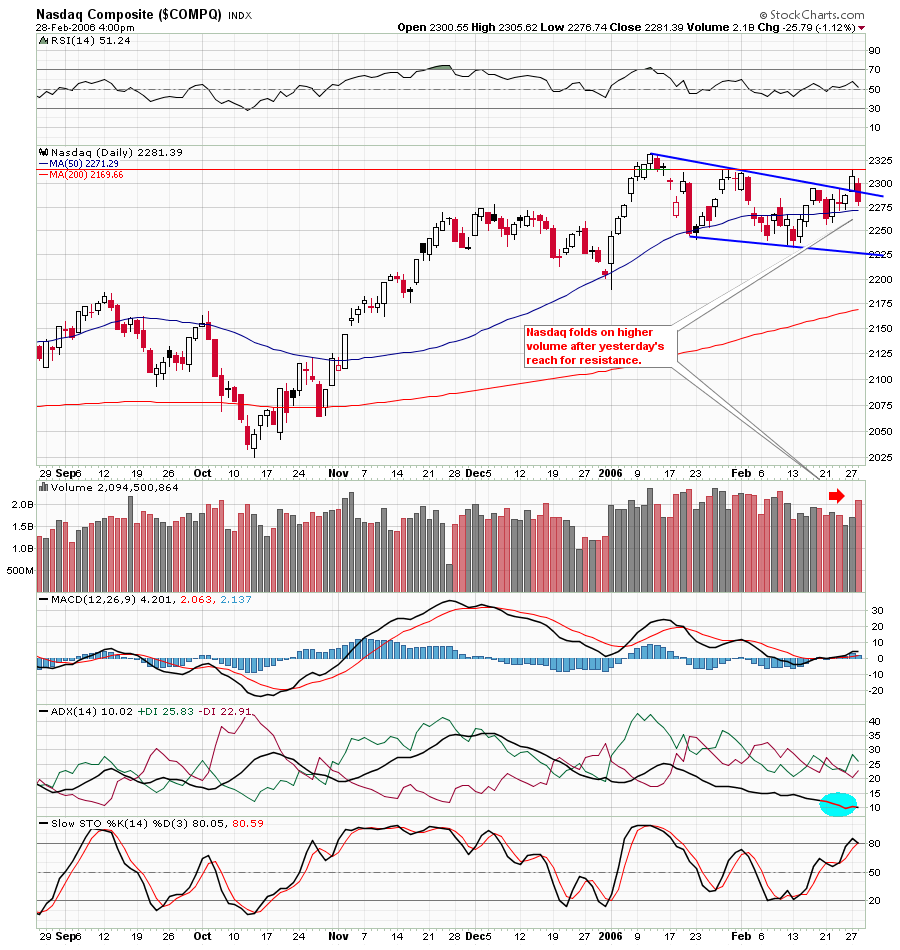 The Nasdaq shed close to 26 points on higher volume thanks, in large part, to GOOG's CFO. So we have a distribution day to end the month. All tech sectors were negatively affected with the big loser being the internet sector. GIN gave back all of its recent gains. Comparatively speaking, the SOX and NWX held up rather well. Let's hope that March gives us more direction than February did.
Trade of the Day - AAPL
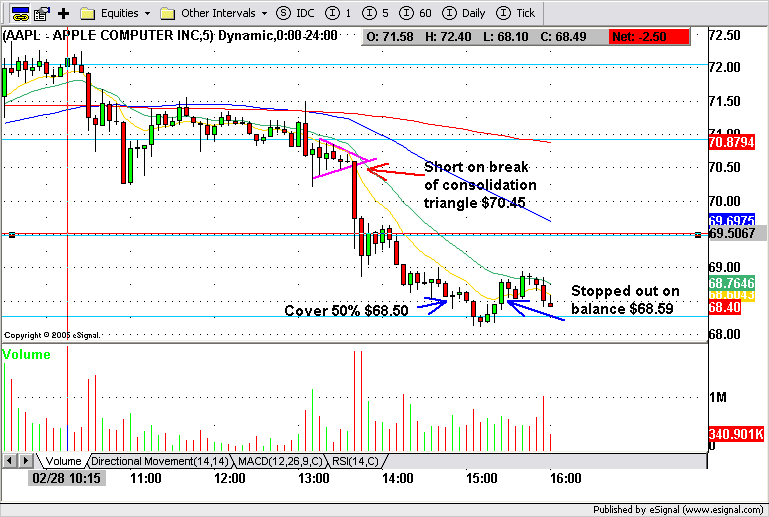 AAPL was a short when it fell out of its consolidation triangle on high volume. I updated readers along the way in my AAPL - Short postings. Click on the chart for a larger view.
AAPL - Short
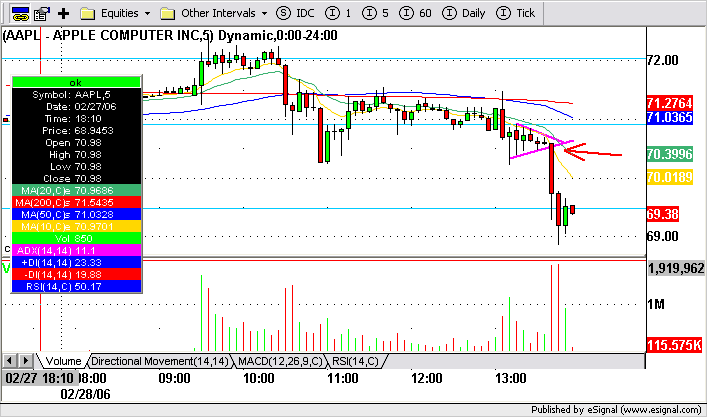 AAPL short on break of consolidation triangle on the 5 minute chart. Just tightened stop to $70.05
Update 2:21 - stop tightened to $69.30. AAPL has support in the $68.00-68.30 area
Update 2:54 - Covered 50 % of the position at $68.50. Stop tightened to $69.05
Update 3:26 - Tightened stop to $68. 57
Update 3:31 - Stopped out on balance of the trade. I will post this as the trade of the day later.
GVHR - Update - Big Earnings Disappointment
 Click on chart for larger view.
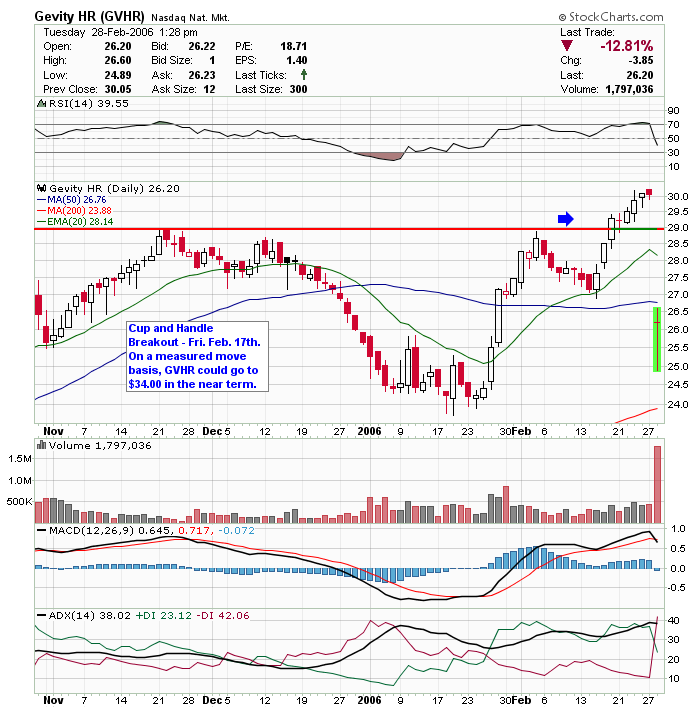
GVHR broke out of a cup and handle pattern on Feb. 17th as per my previous post. Volume never really picked up enough after the break to move price far beyond a $1.00 gain. As mentioned in the original post, earnings were due out today BTB and they missed on both the top and bottom. Here's an updated chart.
References to two previous GVHR posts: Feb. 18th and 22nd.
Is GOOG CFO Bringing the whole Market Down?
Who let this guy out? - Can't control his mouth. Keeps digging himself deeper and deeper. Shorts are in heaven.
In Play - MLNM and JNPR
Update 12:15 I'm keeping an eye on PAYX as it is consolidating yesterday's big move.
Update 12:05 - Sold BOOM $33.99 coming in too fast. Looks like a short.
Update 11:50 - Long BOOM $33.76 - Low risk entry off of the 15 min. chart
Update 10:54 - SNDK - I'm eyeing this one on an orderly pullback to support.
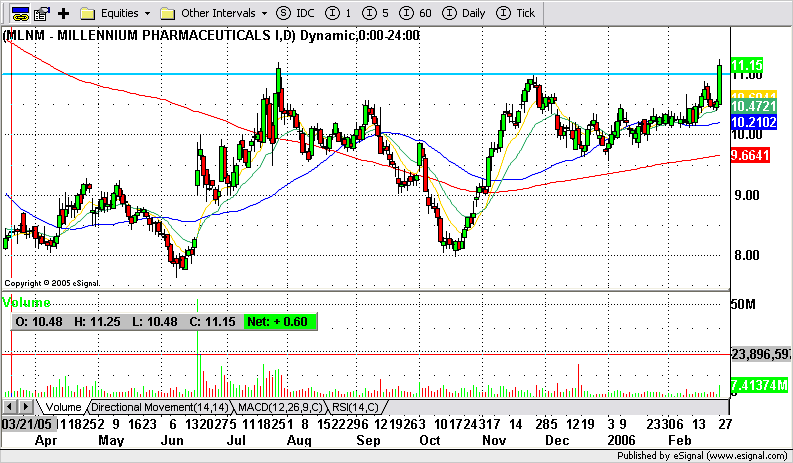
MLNM - Short on the second 15 min. bar. JP Morgan downgrade.
Update 10:20 - MLNM - 1st Fibonacci extension target was $10.25 - covered 50% at $10.33. 2nd Fibonacci target is $10.02. Stop tightened to $10.55
Update 10:40 - MLNM Stopped out on balance of position.
JNPR - Long on second 15 min. bar.
Update 10:30- JNPR enitre position sold on a tightened stop level of $18.25
Update 12:05 - Sold BOOM $33.99 coming in too fast. Looks like a short.
Update 11:50 - Long BOOM $33.76 - Low risk entry off of the 15 min. chart
Update 10:54 - SNDK - I'm eyeing this one on an orderly pullback to support.
MLNM - Short on the second 15 min. bar. JP Morgan downgrade.
Update 10:20 - MLNM - 1st Fibonacci extension target was $10.25 - covered 50% at $10.33. 2nd Fibonacci target is $10.02. Stop tightened to $10.55
Update 10:40 - MLNM Stopped out on balance of position.
JNPR - Long on second 15 min. bar.
Update 10:30- JNPR enitre position sold on a tightened stop level of $18.25
Watchlist - NVAX and MLNM
Monday, February 27, 2006
NVDA - Finally Gets Some Traction
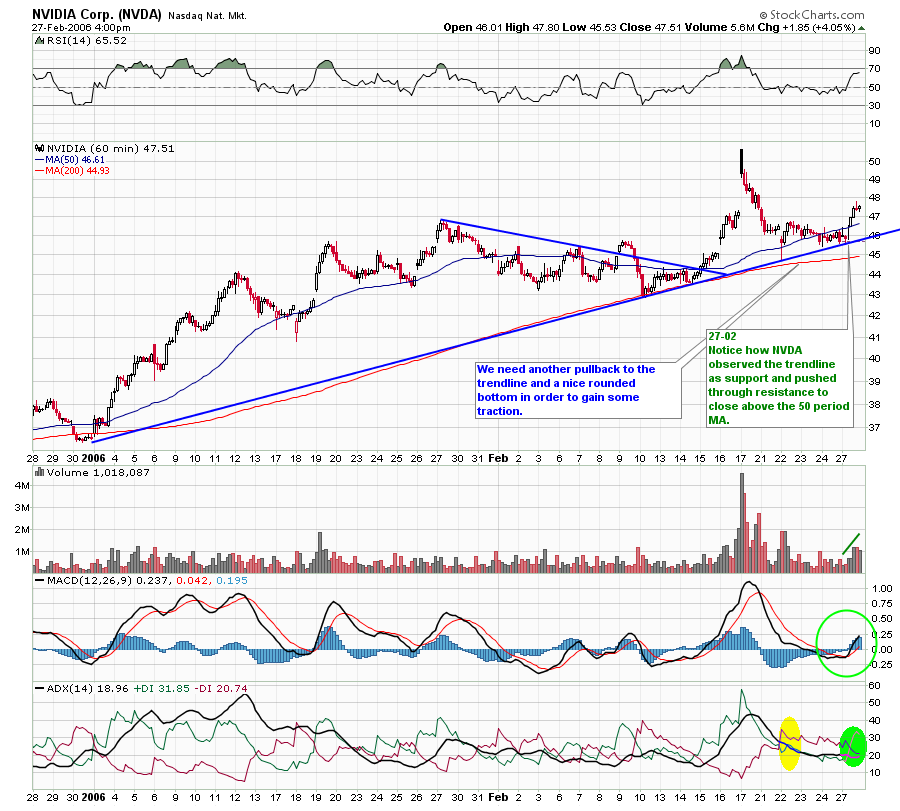
Last week I said that NVDA needed some traction after pulling back hard post earnings. Well today, after pulling back shortly after the open, NVDA got a lot of traction. Here is the same 60 miinute chart as last week with new comments in green. I see some consolidation from this move and a little bit of resistance in the $48-49.00 area, but after that we should be able to retest the highs at $52-53.00.
Nasdaq Technical Picture
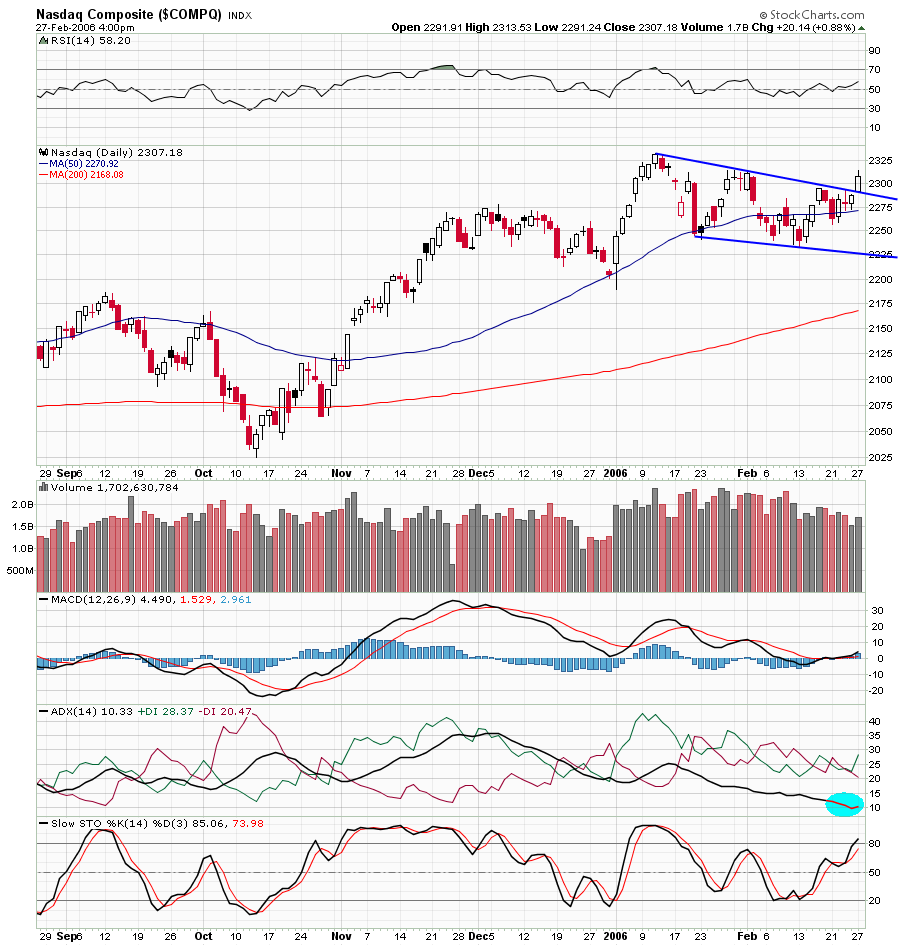 Nice action on the Nasdaq today! After gapping up four points on the open, the Nasdaq continued up for the first half hour and then consolidated for an hour before continuing to climb. Afternoon trade was mostly flat, but overall 20 points were added on a clean break last week's narrow trading range. Volume was higher at 1.7 billion shares which counts as an accumulation day. For the first time since mid January, the ADX line curled up slightly which bodes well for momentum. The NDX outperformed the overall composite by a ratio of 1.3:1.0 which means that some of the bigger names performed really well. SNDK, which I bought in pre-market was the top performing stock in the NDX. NVDA which I will discuss in a later post, was in the top 10. Biotechs and Hardware continue to lead.
Trade of the Day - SNDK
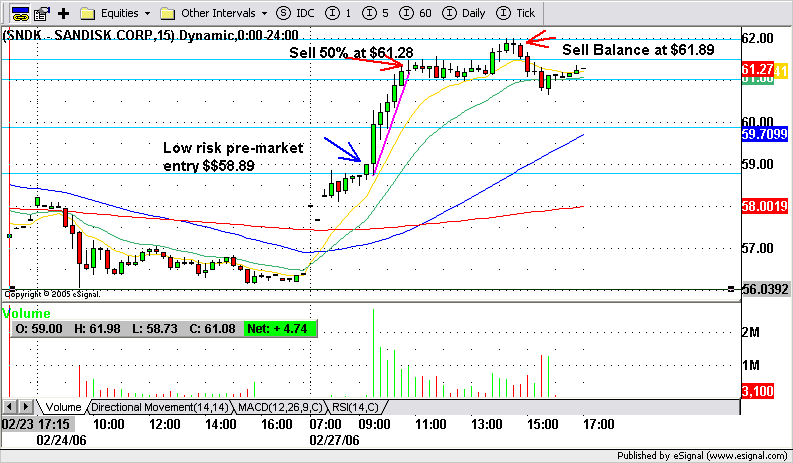 I chose to get in SNDK before the market open because of the Citigroup upgrade from Hold to BUY and the narrow range bars. I had a good feeling about this one and didn't want to risk chasing it. It worked out perfectly.
GNSS was also a good trade. It pretty much stayed in the range of the pivot points I documented here on Saturday. ROS didn't work out but I managed to sell just 0.02 below my entry price in the last hour.
In Play
Long: GNSS $21.07, SNDK in pre-market $58.89 , ROS $21.30
SNDK - watching 20 day EMA $61.00 for resistance - tight stop
SNDK Update 10:58 a.m. - Sold 50% at 61.28 because the stock made a lower high on the 1 minute chart in the area of resistance of its 20 day ema.
SNDK Update 12:45 p.m. - Keep a tight stop during this consolidation. There's not much in the way of support until $60.00 - $60.50. Current price $61.00.
Sunday, February 26, 2006
AMD vs. INTC
AMD
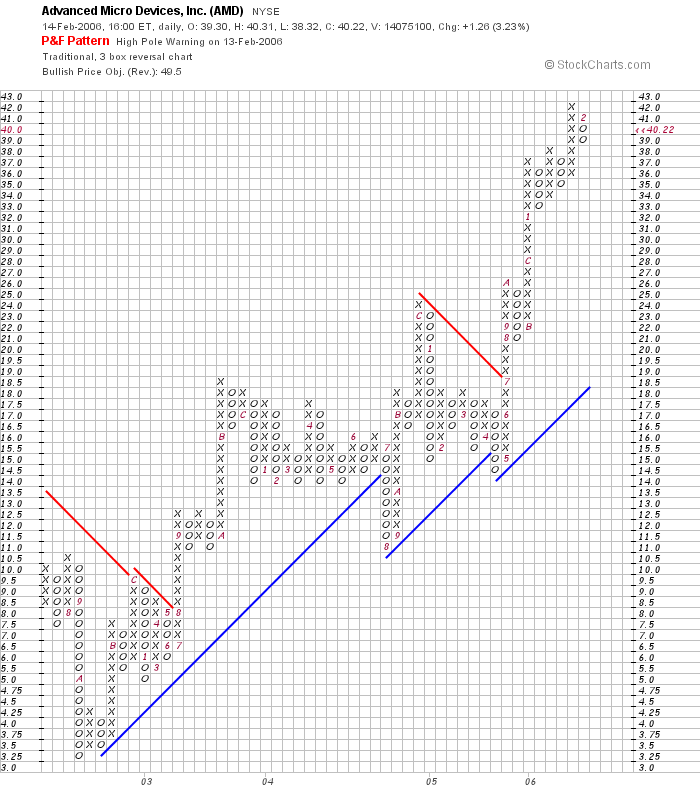
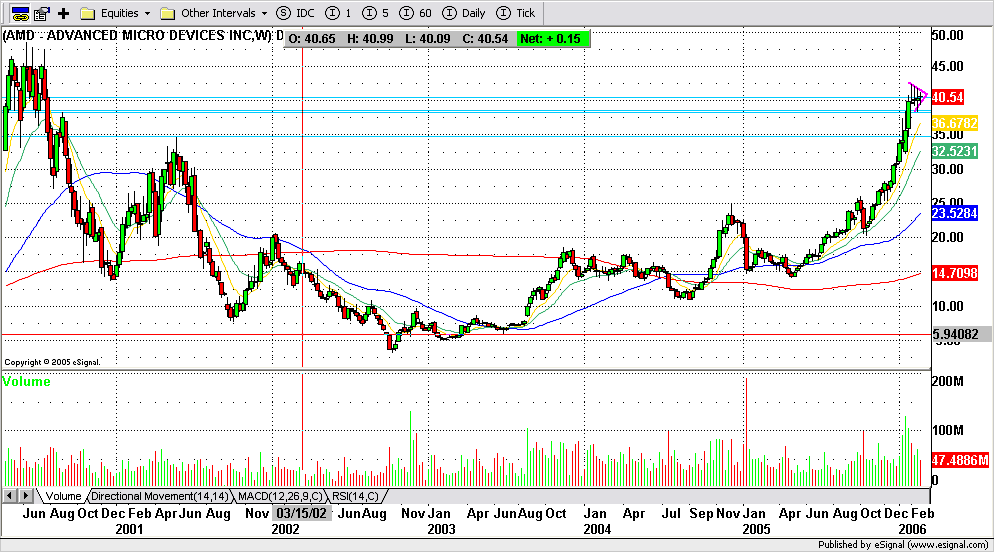 AMD is in the process of consolidating its recent gains on lower volume. It's also forming a cup which has been developing over several years. On a break of its pennant formation and on a measured move basis it should be able to retest its all time highs in the near term. The target price on the P&F chart is $49.50. We could see new money coming into the stock this week as institutional buyers traditionally put their money to work at the beginning of the month.
INTC
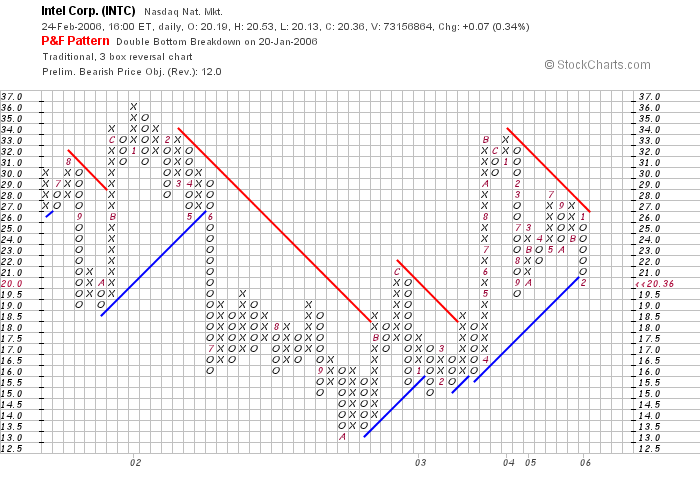
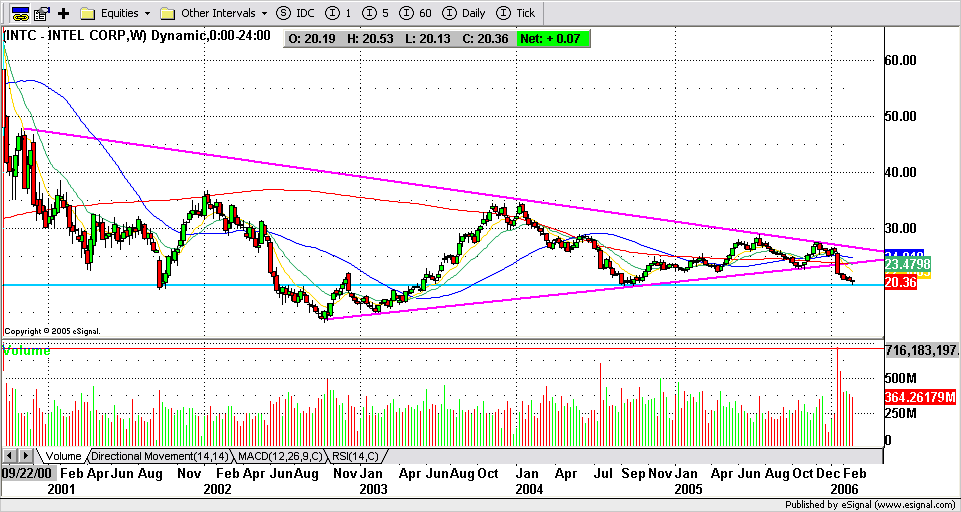
INTC is sitting on notable support and should get a lift in the short-term, however, its troubles are far from over and the technicals indicate that it has much further to fall. The weekly chart above shows that the current pattern has been building for a very long time. The technical break took place on extremely high volume which is very bearish. The P&F chart clearly shows the break in the triangle pattern and has a preliminary bearish price target of $12.00.
Short Interest
When a stock breaks out to the upside, the early part of the move is often attributable to a short squeeze. Not many financial news sites publish the percent of short interest for individual stocks. Reuters is one of the few that I can find that provides this information with a free membership. In the left side panel under the section "Sentiment" you will find the header "Shares Shorted". If you're interested, check it out here.
Saturday, February 25, 2006
GNSS - Classic Retest of Trendline
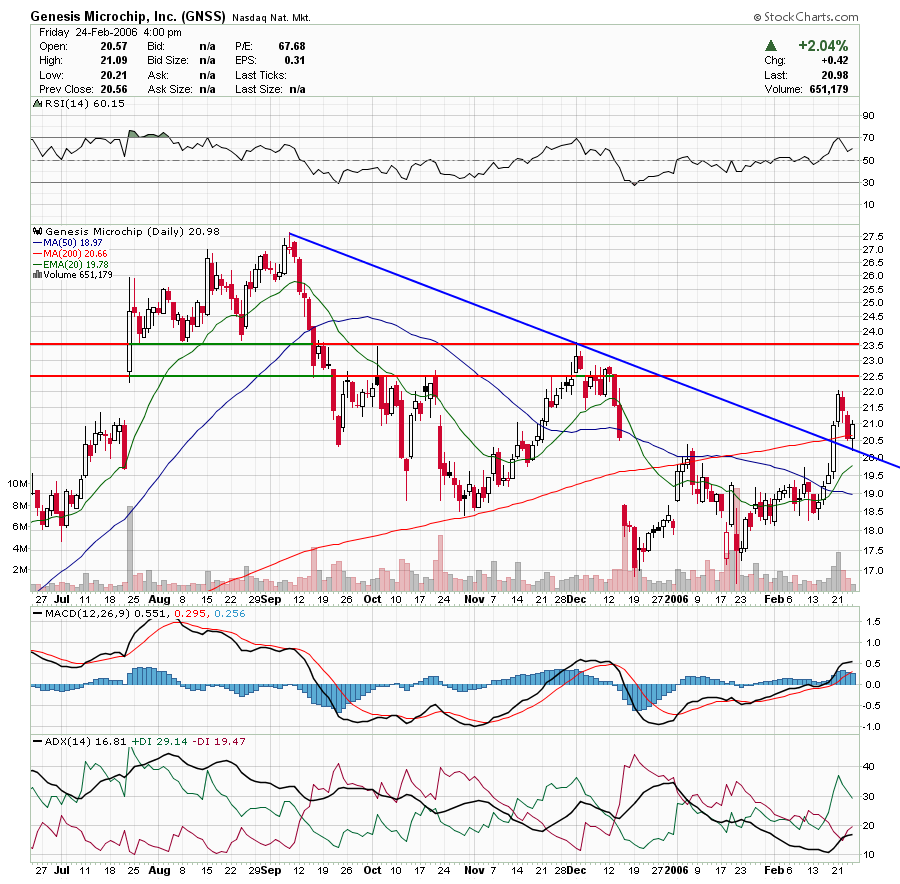 After retesting its trendline on the open yesterday, GNSS advanced quickly to its next pivot point ($21.05) in early morning trade. We have a few more pivots to overcome before we can break last week's high as follows: $21.05, $21.50 - 21.75, and, finally $22.00. Resistance levels above $22.00 are clearly marked on the chart above. The chart technicals are still strong and Friday's candle managed to to retrace more than 50% of Thursday's bearish candle so it appears that support will hold and we can look forward to more upside price movement soon.
Friday, February 24, 2006
Nasdaq Technical Picture
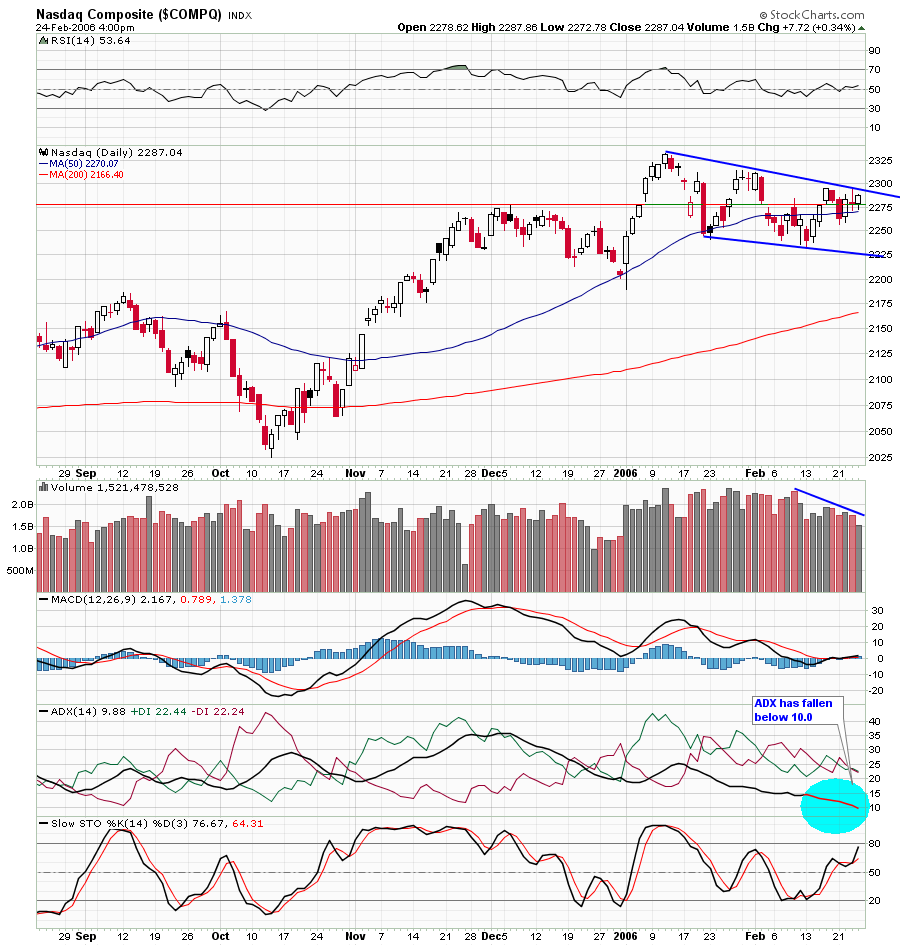 The Nasdaq had another low volume, narrow range trading day. There is little of note to report. The NBI had another great day. Most other tech sectors had narrow gains or losses. The trading range for the entire holiday shortened week was just 37 points. The ADX fell under 10.0 today which supports the lack of movement. Geopolicital concerns and oil prices continue to dominate the headlines. Hopefully, next week will provide more direction.
Trade of the Day - NTES
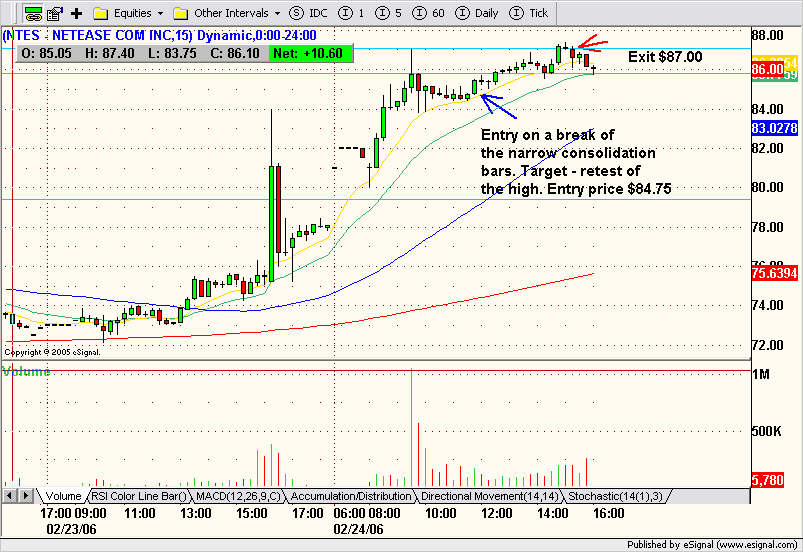 NTES on a pullback to support of the rising 10 period EMA and following an orderly shallow consolidation with narrow range bars.
Sweet!
NTES
After consolidating its pre-market gap up all morning, NTES looks like it is setting up to break out.
In Play - GNSS and RMBS
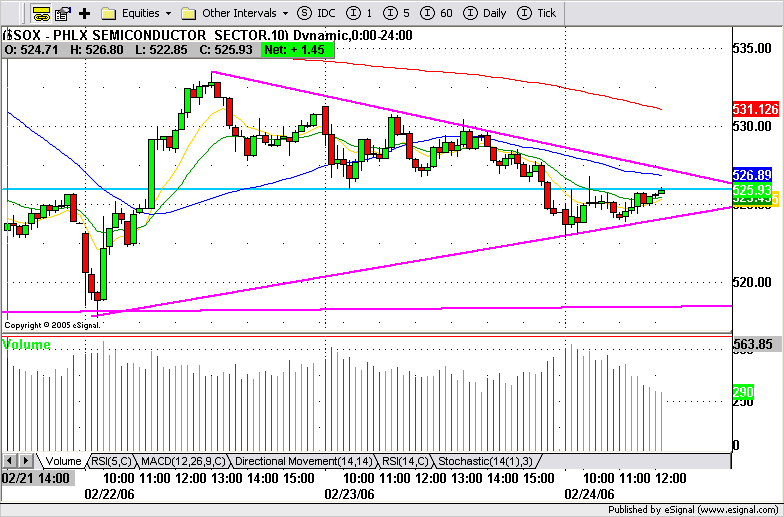
The SOX is attempting to break resistance (blue line), but we need a spike in volume to give it a boost.
Longs: GNSS off of the opening range; RMBS on the pullback.
Thursday, February 23, 2006
Nice Move on RMBS Today
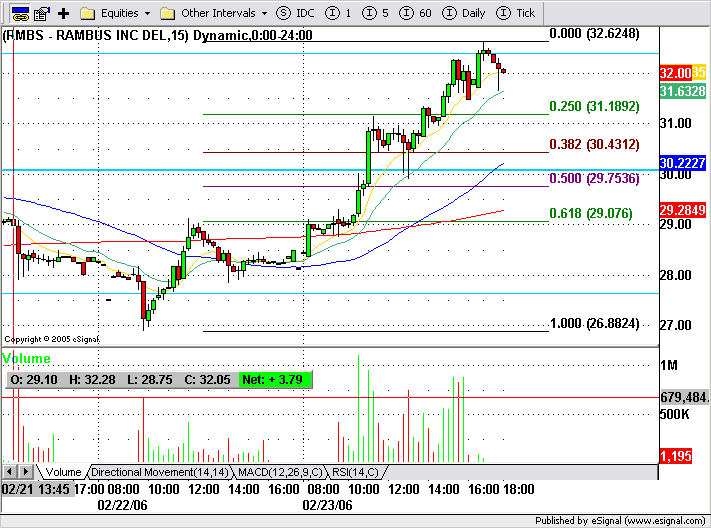 Tuesday I recommended RMBS for a potential long with a preliminary target of $32.00. Unfortunately, I was a little too early in my call and when it pulled back, I removed it from my long watchlist. Too bad for me. I've plotted the fibonacci retracement levels on this new chart for a potential second long.
Semiconductors - MRVL May Save Sector from Further Deterioration
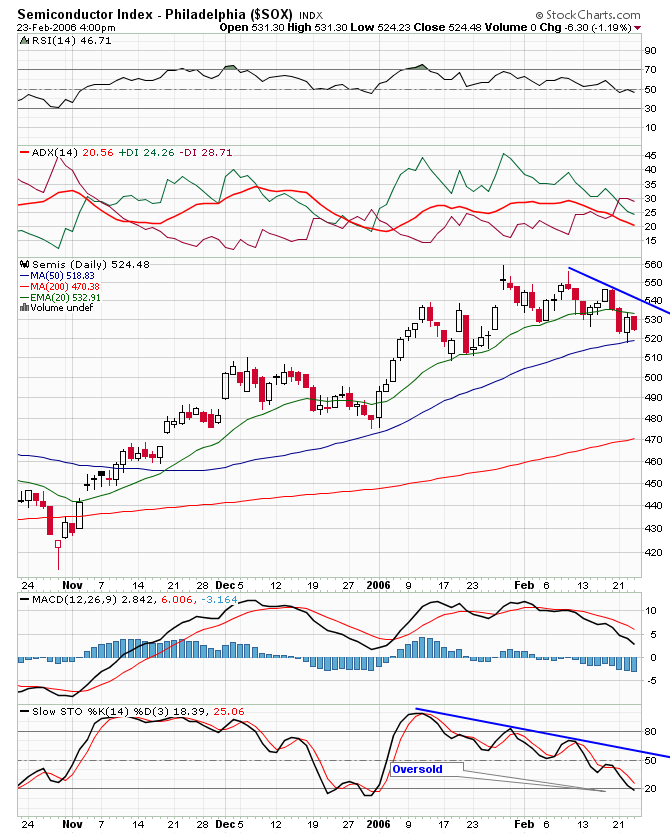
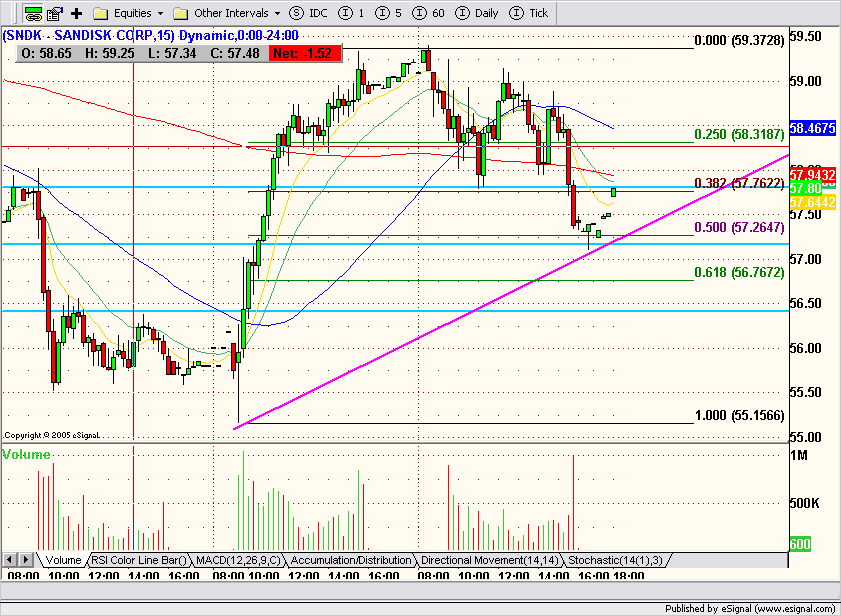
The SOX was one of the worst performing tech sectors on the Nasdaq today, giving back most of yesterday's gains. After the close MRVL beat on revenues, earnings and margins and guided higher for Q1 and full year. It also announced a 2 for 1 split. It added about $4.00 from its closing price in AH trade. BRCM also added about one point in sympathy with MRVL. This should give this oversold sector a much needed boost to end the week.
I will be looking closely to see how MRVL opens tomorrow. It will be very important that it not give back the AH gains in tomorrow's trading session like we saw last week with NVDA. My favourites for tomorrow, if the SOX is bullish are BRCM, SNDK, TRID and MXIM. These four names did not give back all of yesterday's gains today, and they are all trading higher in AH except TRID. BRCM appears to be the strongest of the three, but SNDK is deeply oversold, MXIM is sitting on support and TRID is trading into strength. Below is a 15 chart of SNDK. The blue lines are pivot points.
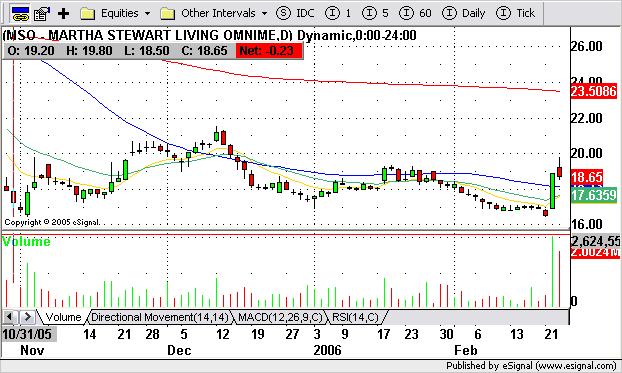
Trump / Stewart Dispute is a Ploy

The whole Donald / Martha dispute is a ploy devised to draw attention to the Donald's next Apprentice series which is set to debut February 27th and to pump Martha's stock out of the gutter. It's working. Way to go Martha! It helps draw attention away from the $0.09 miss you had on your earnings.
Nasdaq Technical Picture
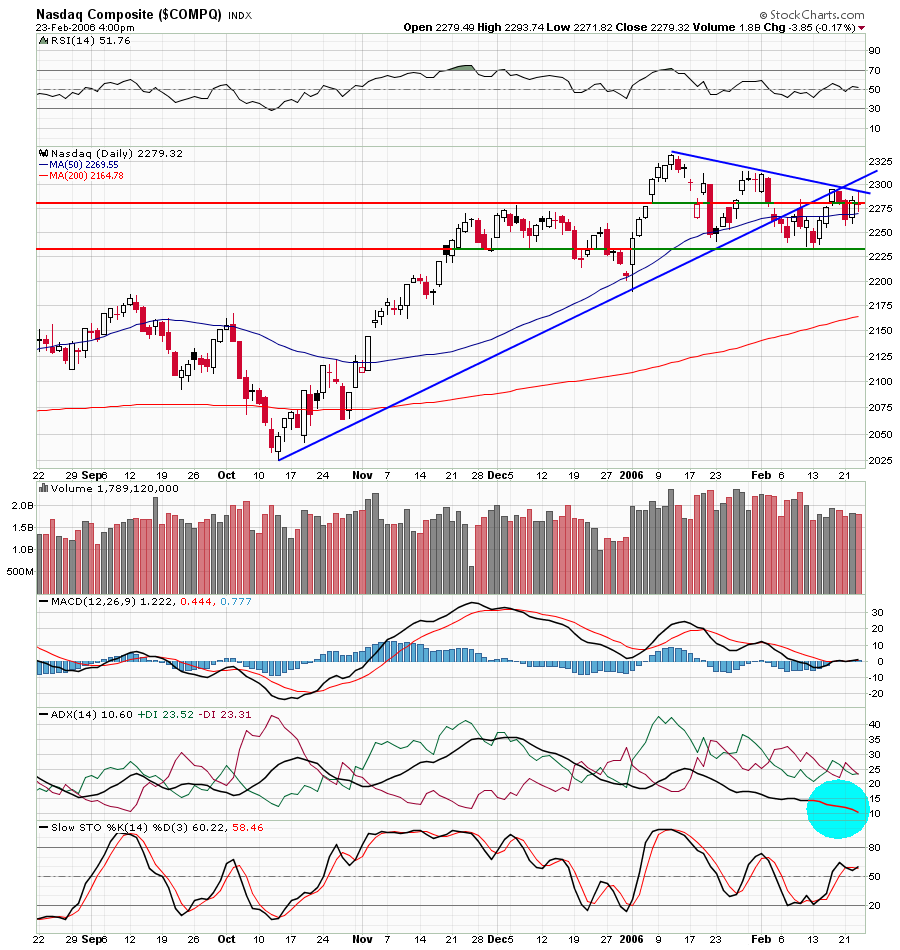 Another indecisive day for Nasdaq. Most of the action was limited to the upper half of yesterday's range. In the end, we carved out a doji candle with a long upper shadow and a loss of just 4 points. Volume was lower than yesterday so this is not a distribution day. We managed to close just above the December high and we are still sitting above the support of the 20 and 50 MAs.
Take note that the ADX line is now at 10.6 which is an extremely low reading and supports the lack of momentum. Conversely, when the market finally decides where it wants to go - up or down, the move from this low reading will likely be explosive.
Trade of the Day - SNDK
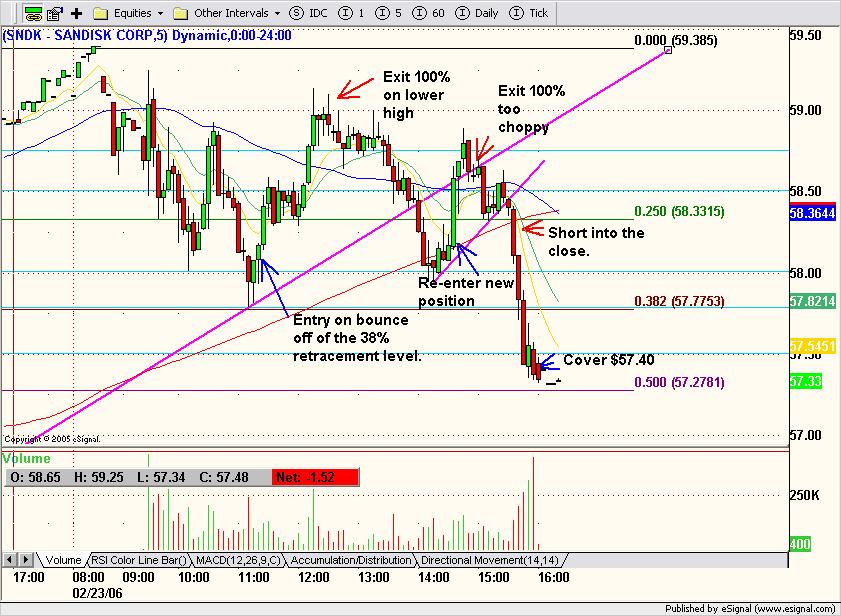 Took a long position in SNDK on a 38% retracement from yesterday's low to the opening high. It had a nice bounce but no real follow through action in the afternoon. Short into the close to try and get a little more out of this rather frustrating trading day.
Update on Feedburner
This is a follow-up to yesterday's post. My feed is now updating in "My Yahoo". The problem seems to have resolved itself.
Semiconductors - Update
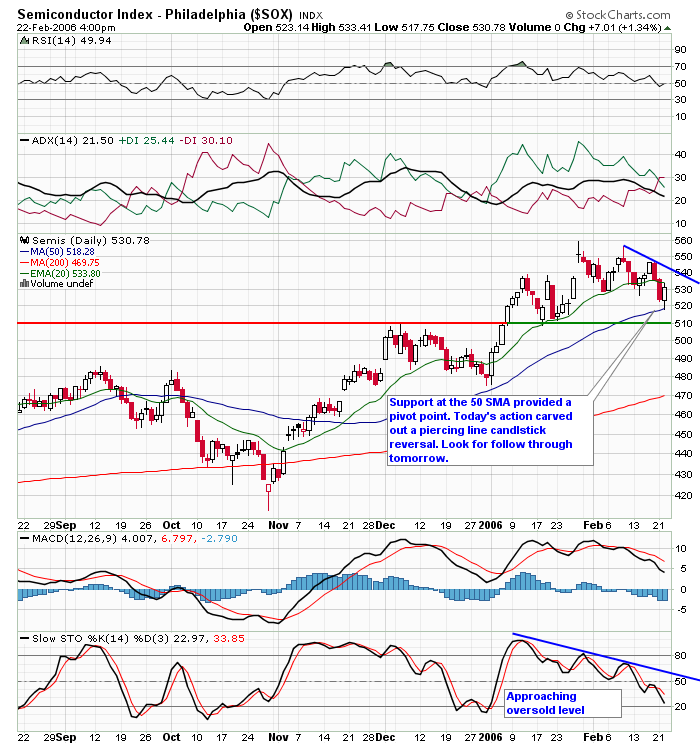 After gapping lower on the open, the SOX found support at its 50 day SMA and carved out a piercing line reversal pattern. Many of the top names in the sector had similar patterns. As noted on the above chart, the SOX is approaching the oversold level and could see an interim bounce to 540. Some names of note and their corresponding patterns for Wednesday Feb 22nd are: Bullish engulfing: MRVL, AMD, SNDK and LLTC (this last name close to a bullish engulfing). The last two names were on higher volume. CREE carved out a bullish morning star pattern. MCHP, TXN, and KLAC qualify as piercing lines and I really like the volume on MCHP. Other names which were bullish yesterday were MXIM, BRCM and TRID.
N.B. The pullback is still in play as the SOX continues a series of lower highs and lower lows. However, within that context, we will rally towards resistance at key pivot points.
P.S. I'm still very bullish on GNSS which is consolidating its recent gains.
Wednesday, February 22, 2006
Is JNPR Setting Up to Rally?

JNPR is attempting a rally off of its recent lows. I would be a buyer on a shallow pullback to $17.50, a notable pivot point from its original fall in January. If $17.50 doesn't look like it's going to hold, wait for a retest of $17.00. The target is a return to the apex of the triangle around $19.25.
NVDA - Needs Some Traction
NVDA - 60 Minute View
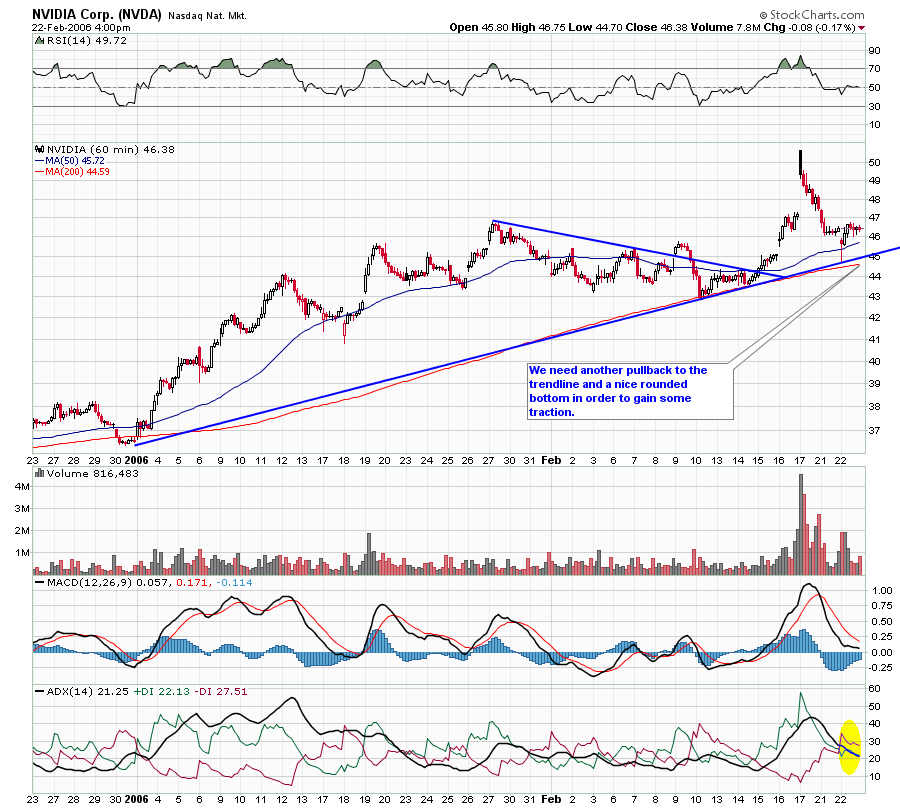 In early morning trade NVDA came back to its trendline and managed a small bounce, however, it lacked traction and fell into a doldrums phase in the afternoon. I'd like to see another pullback to the rising trendline (in line with the 200 period SMA) and a nice rounded bottom so that NVDA can take off with more momentum. I'd also like to see a positive crossover on the ADX.
Nasdaq Technical Picture
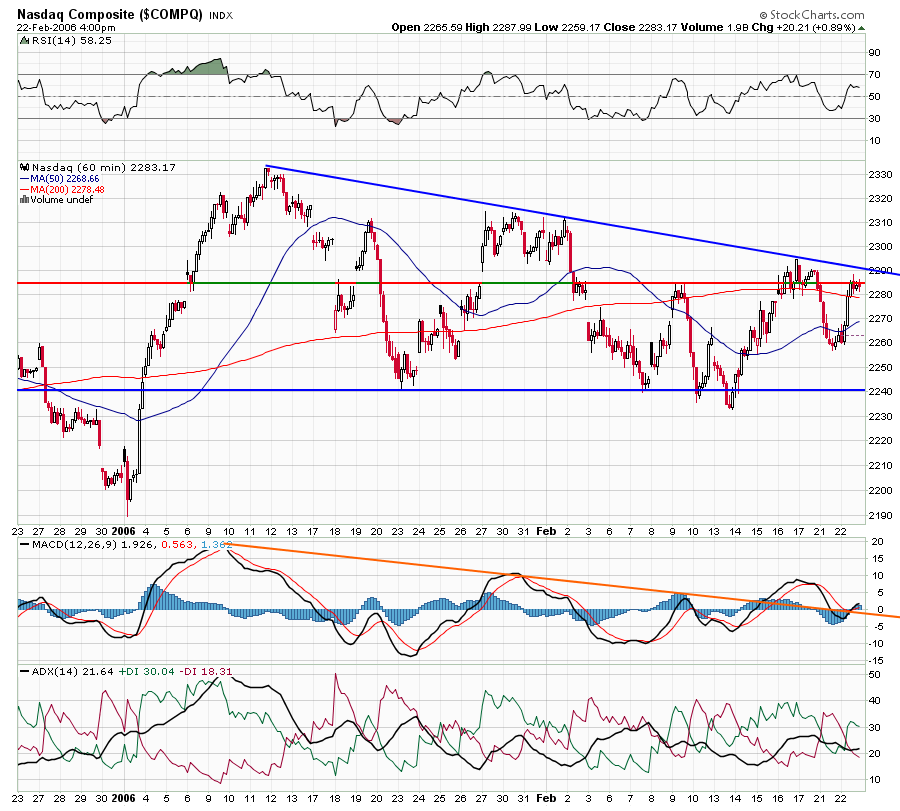
 The Nasdaq did a 100% retracement of yesterday's loss on slightly higher volume which indicates accumulation. All of the major tech sectors were positive today. We are still in a stage three consolidation and it is difficult to predict when and how we will break this triangle. The best way to play it is one day at a time until the pattern develops itself and/or we can get a better read on the indicators and oscillators. I am focusing on pivot points as key reversal areas in order to stay positive in this diffcult trading environment.
Trade of the Day - AAPL
 As discussed here yesterday, AAPL would likely attempt to retest resistance before it became a short candidate. I took advantage of its momentum in the morning after it retested support at $68.00 (support dates back to Feb. 14th and 15th). Trading off of the 5 minute chart, I took my position after the first bullish signal.
N.B. - Today's close was much more bullish than previously anticipated. We have a bullish engulfing pattern on the daily and a close above the 20 day EMA. Consequently, I'm not looking to short AAPL at this time even though we have notable resistance overhead in the $72.00 area.
FeedBurner
I added a feedburner to my site this weekend. I'm having a feed problem with My Yahoo ( my feeds don't update automatically in My Yahoo). If anybody has any tips on how to fix this, I'd really appreciate if you left me a comment or sent me an email. I'll post an update when the problem is fixed. In the meantime, sorry for the inconvenience.
GVHR - Update
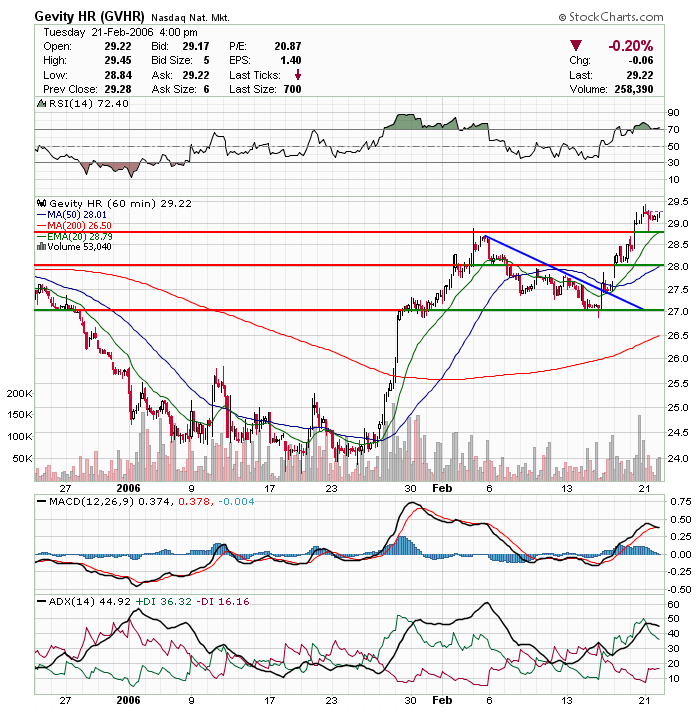
GVHR failed to follow through on Friday's cup and handle breakout. I had anticipated higher volume after the break when it would show up on 52 week high scans. That certainly was not the case today, however, it did test and hold support at $28.80. The 60 minute chart view shows some potential weakness coming into the RSI and MACD. We'll see how it behaves tomorrow.
Tuesday, February 21, 2006
AAPL and RMBS - Short on Break of Support
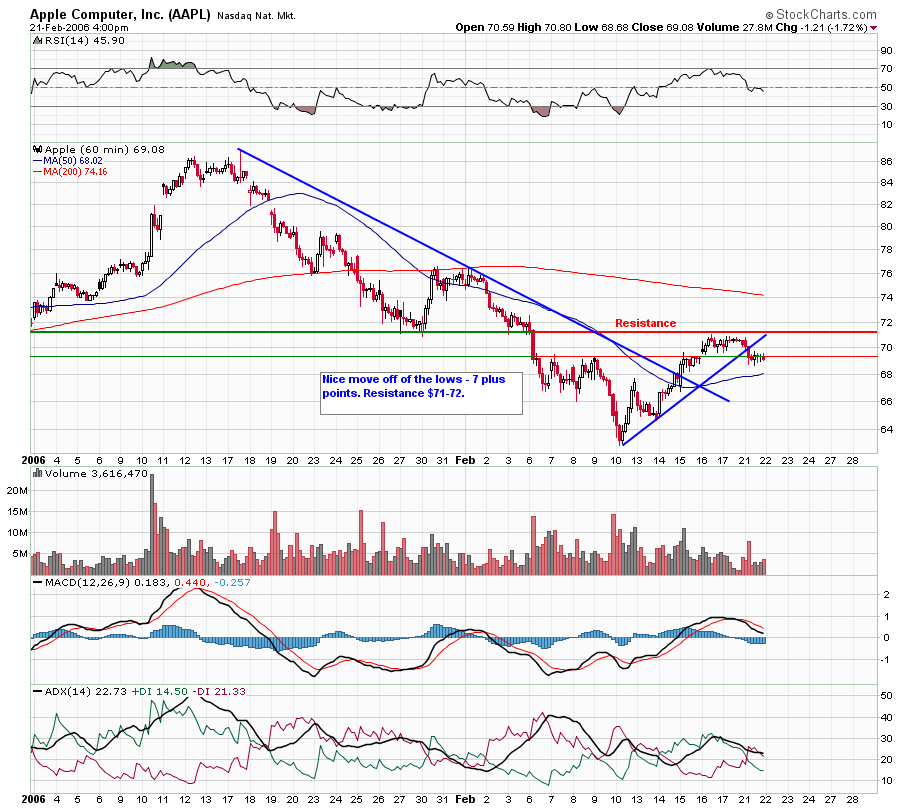 From the 60 minute chart above, we can see that AAPL is just hanging on to support. With any luck, it will attempt to rally back up to resistance in the morning, and fall back down in the afternoon, so that we can get two trades out of this name in one day.
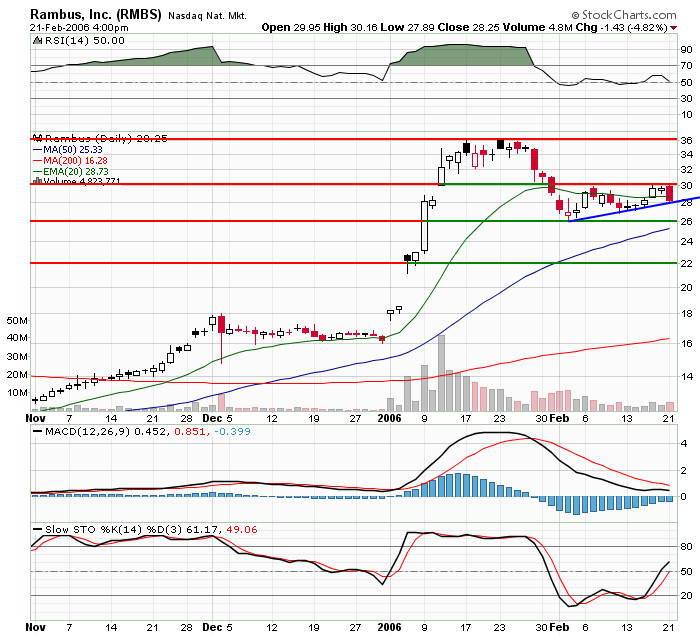 RMBS is a potential short on a break of $27.50. Support levels are $26.00, followed by the 50 period SMA, followed by $22.00 as outlined on the above chart.
GNSS - Update
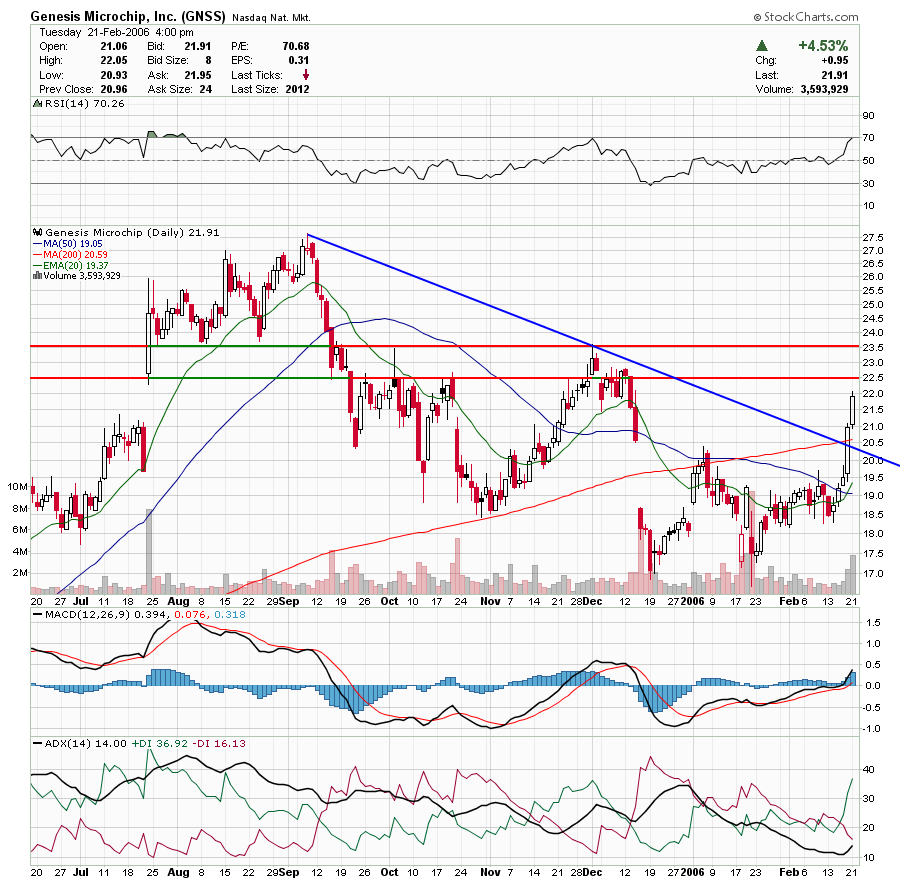 As discussed in the Trade of the Day Post, we had a nice continuation move higher with GNSS today. Keep in mind that resistance lies just overhead at $22.50 and again at $23.50.
BRCM - Technical Damage
 BRCM closed below its tight trading channel for the first time in three weeks. It is currently sitting on the support of its 20 day EMA. However, if it takes out last Tuesday's low it will be vulnerable to a correction back down to its gap support in the $40.00 (post split) area.
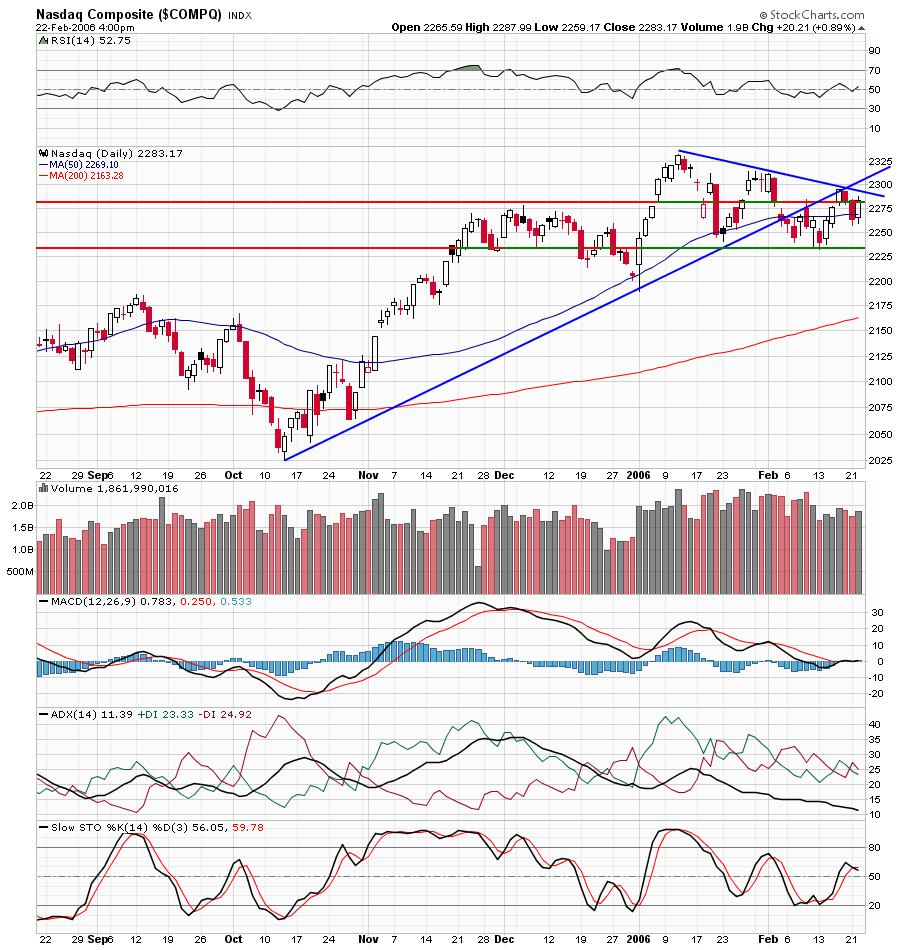
Nasdaq Technical Picture
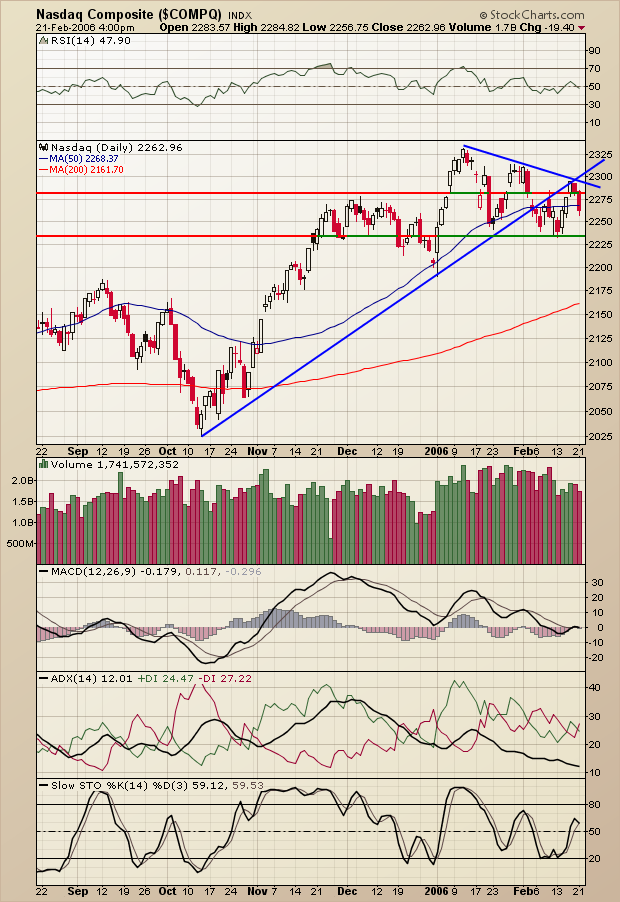 The Nasdaq is in a stage three consolidation and once again has closed below its 50 day SMA. It is normal during stage three for price to weave in and out of the 50 period SMA. The Nasdaq shed almost 20 points today on lower than average volume. All tech sectors were weak coming out of the three day weekend. The SOX was the weakest sector with some technical damage to specific names which I will cover in my next post. Oil seems to be in control, however, I believe this to be a tenuous situation because inventories keep increasing and don't justify these prices.
Trade of the Day - GNSS and RIMM
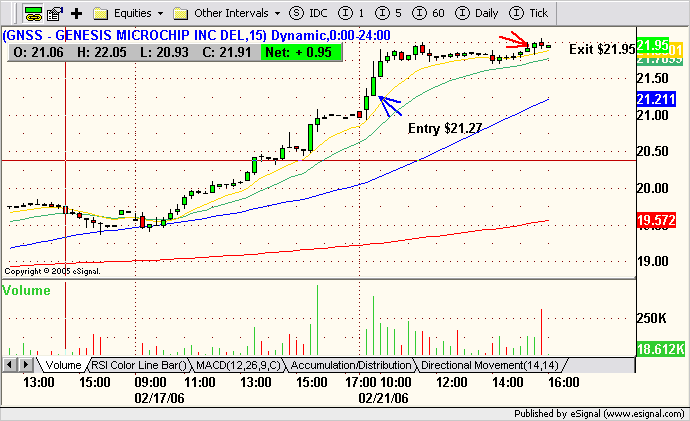 As highlighted in my weekend posts, GNSS was strong and could move higher. As soon as the real body of the first 15 min. bar was taken out, a position was taken. Exit into the close.
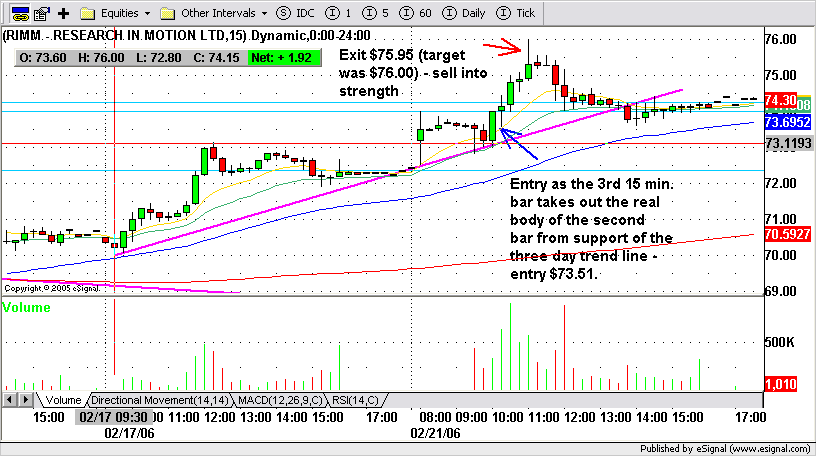 RIMM traded up in pre-market but fell nicely into the support of its trendline as the market opened. The first 15 min. bar was weak but formed a hammer which implied a potential reversal. The second bar was also weak but did not take out the low of the first bar so this was an indicationt that the support of the trend line was holding. The third bar was bullish and a position was entered .05 above the real body of the second bar. The entire position was closed as price approached $76.00. I'm not looking for continuation tomorrow as RIMM formed a long upper shadow on the daily chart and looks like it could move lower, or at least consolidate from here.
5:08 p.m. - We had a few good trades this morning with RIMM and GNSS. I will be publishing my regular daily posts later tonight (after 10:00 p.m. EST) as I have some personal business to attend to.
ENER - Tops Trading Range in Pre-market
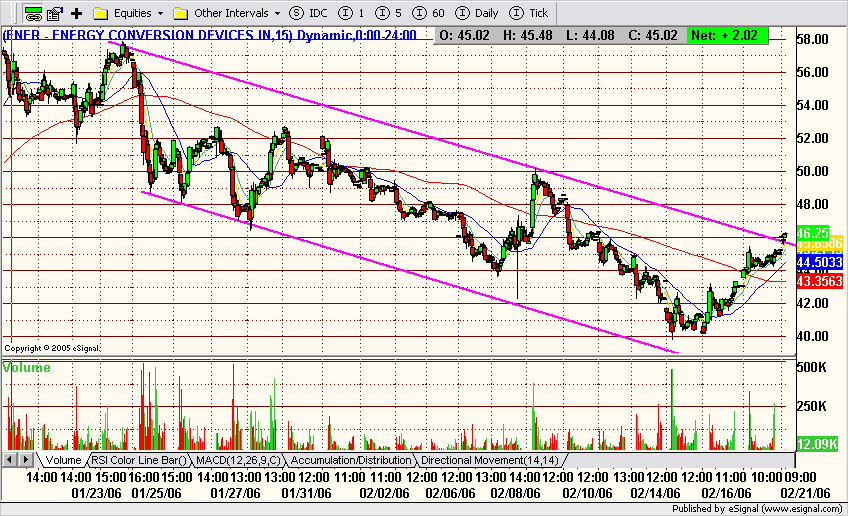 ENER - 15 minute chart shows that the pre-market action has exceeded the top of the recent trading range
Watch List - Short-term Long - RMBS, RIMM
 RMBS had a sharp pullback from its January highs and was recently stifled by the resignation of its CFO in early February. However, now it has made a higher low and appears ready to break its February base to the upside. This is a short-term move which will likely result in a lower high notwithstanding any new catalyst. My target is $32.00 - $34.00.
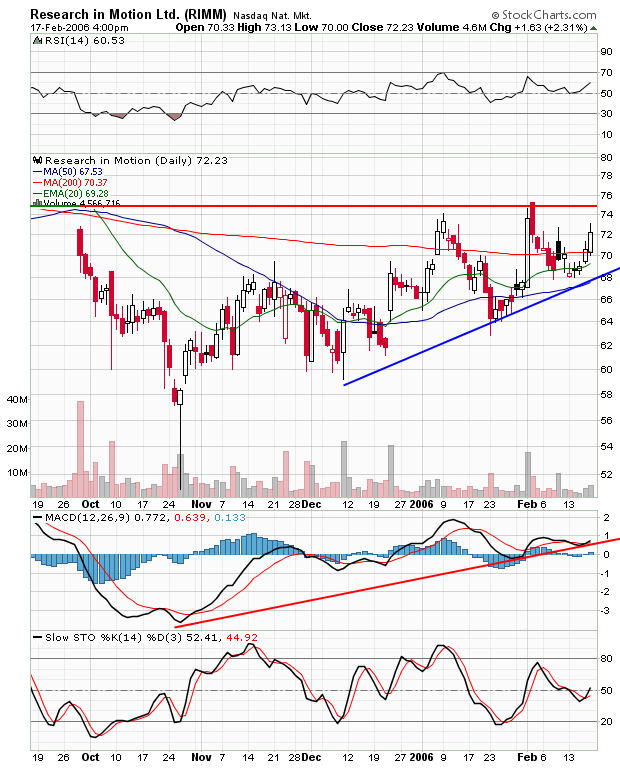 RIMM is a very short-term trade setup in anticipation of Friday's patent dispute verdict. The judge wants this case off of his docket and is unwilling to wait for the patent office which lags behind the court system. This case has high drama and by Friday Feb. 24th we should have some sort of verdict/settlement. In the meantime, RIMM looks well positioned to retest the top of its base.
Sunday, February 19, 2006
Semiconductors for Wireless Communications - QCOM and BRCM
QCOM
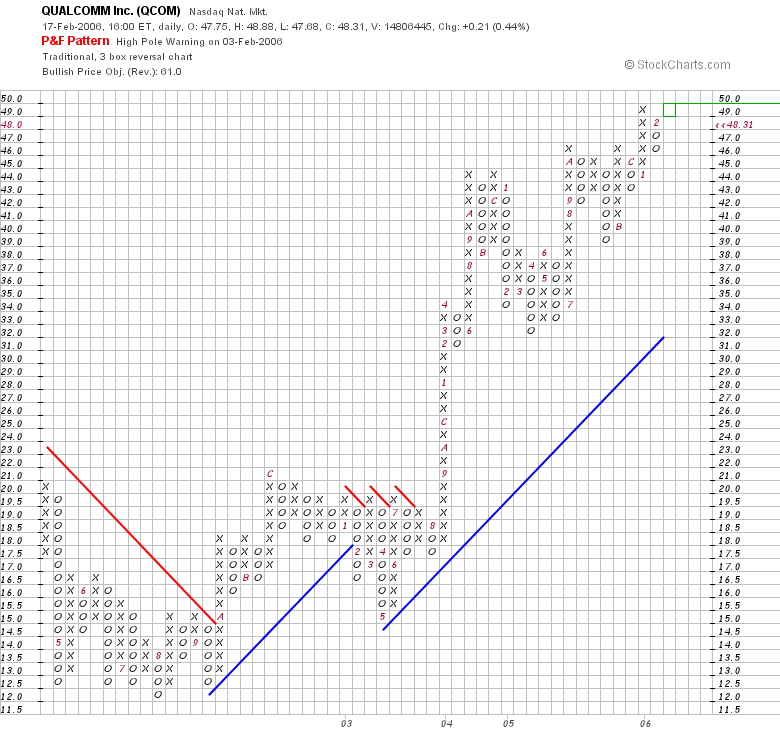
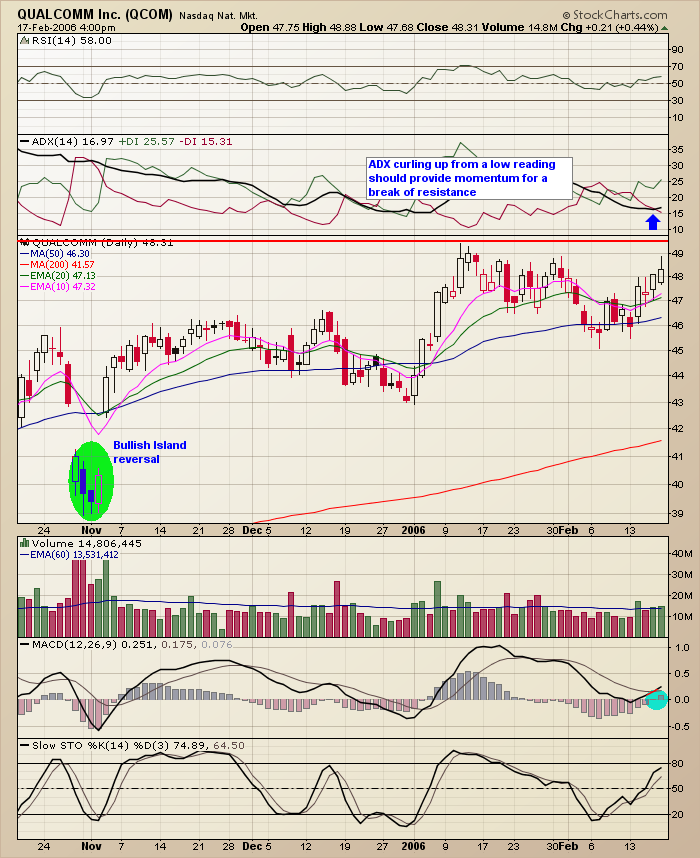
The entire QCOM chart is bullish and, everything else being equal, it should break resistance any day now. The P&F chart has a bullish price objective of $61.00. From Friday's close of $48.31 we have a lot of bullish action ahead.
BRCM
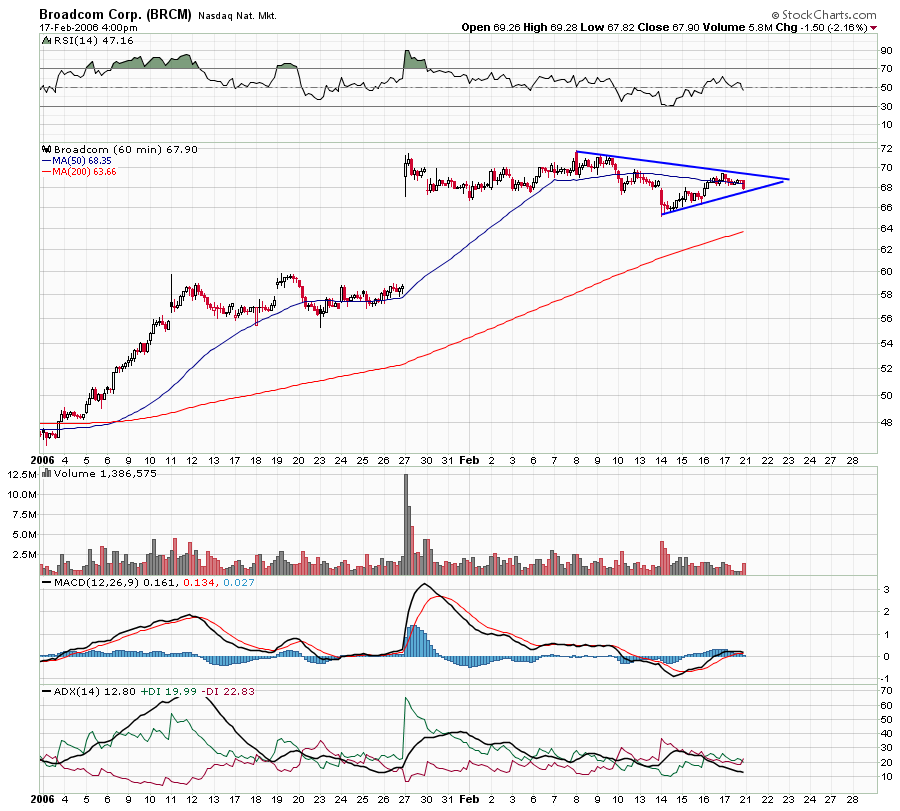

BRCM is currently consolidating in a bullish flag formation following a stellar earnings report three weeks ago. It briefly fell out of its consolidation support on an intraday basis on Tuesday and again on Wednesday, however, on a closing basis, the flag support was not violated. For the most part this has been a lower volume consolidation with normal oscillator variations. Friday's low volume price activity formed an inside day closing on its 10 day EMA.
A look at the 60 minute chart, shows that BCRM's price has been weaving in and out of its 50 period SMA which is normal in a stage three consolidation. Violation of the flag support on a closing basis would be a strong signal that BRCM will attempt to close its bullish gap.
N.B. - Part of BRCM's vulnerability here is due to the ongoing QCOM/BRCM patent dispute which got some press again this past week.
Subscribe to:
Posts (Atom)