 Click on charts for larger views and chart notes.
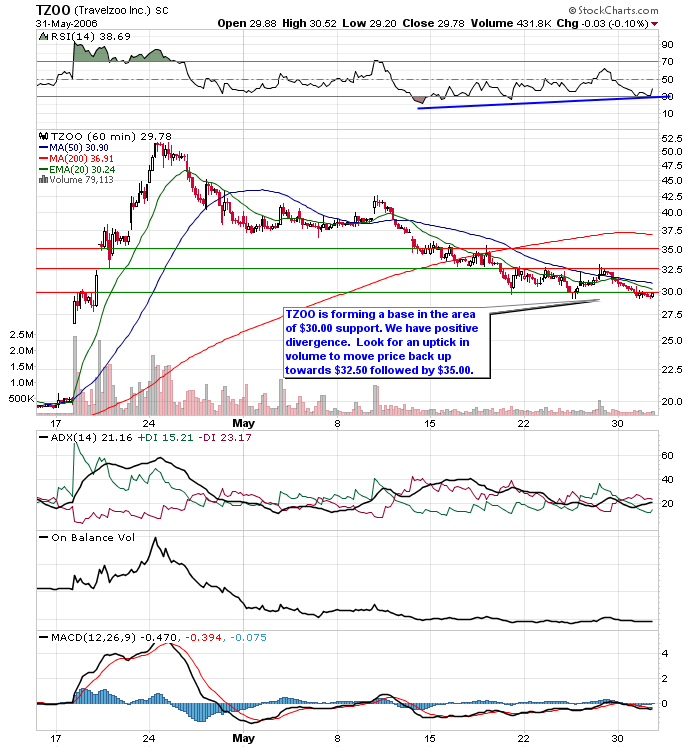
 TZOO carved out a star like candle and held support of its 50 day MA. Look for an uptick in volume to move price back up to $32.50 followed by $35.00. Also watch the ADX line for a break in momentum.
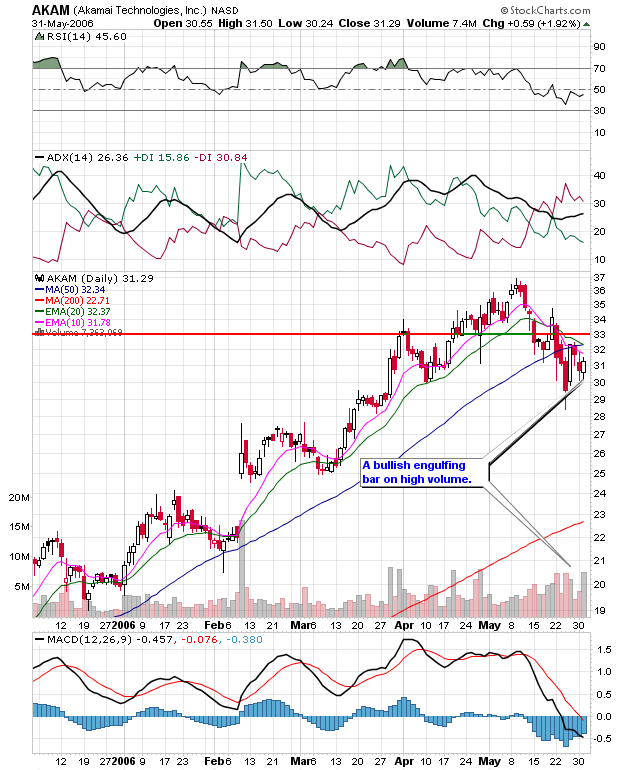
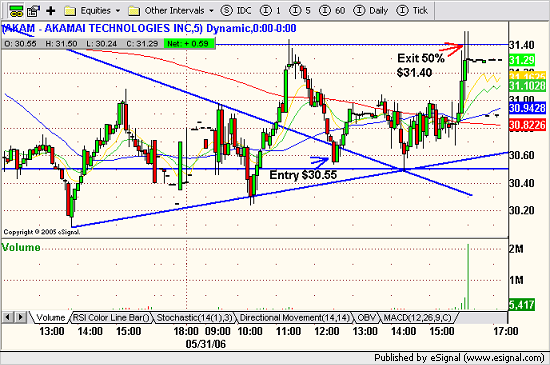 Picked up AKAM on weakness around midday as it appeared to be making a series of higher lows. I sold 50% of the position into the close as it retested the morning highs in the $31.40 range. I'm swinging the balance of the trade into tomorrow and my stop is set at $30.45 just below the afternoon low and my original entry point. My target is $32.40.
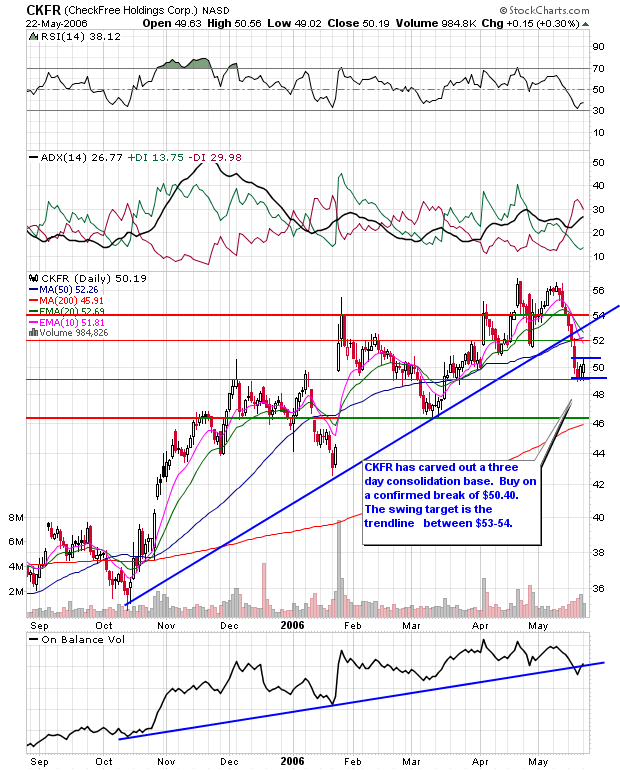
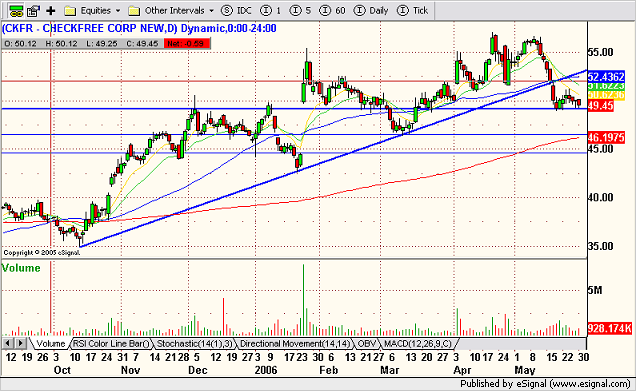 Any further weakness could push CKFR towards its rising 200 MA.
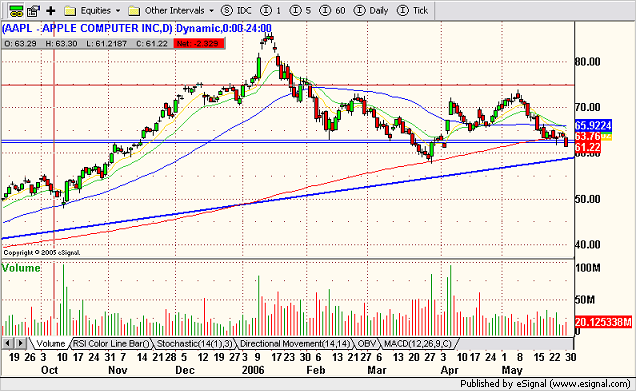 This is a daily view of AAPL which is fast approaching its trendline support around $60.00.
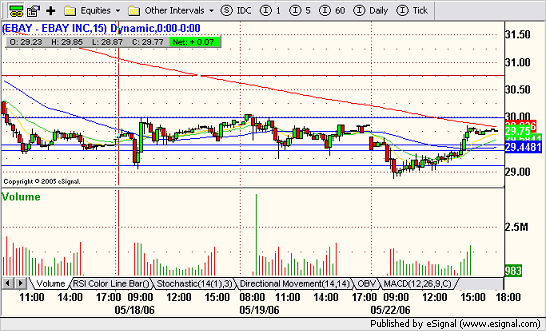
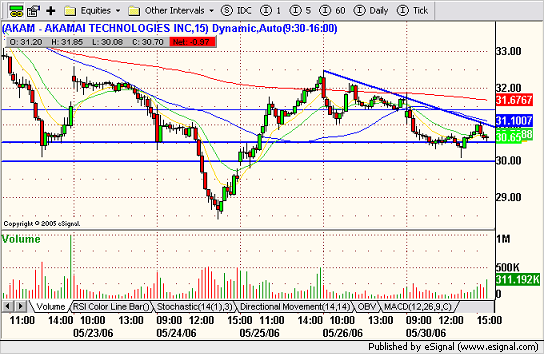 AKAM looks like it wants to break its short-term downtrend. From the 15 min. view - support at $30.00.
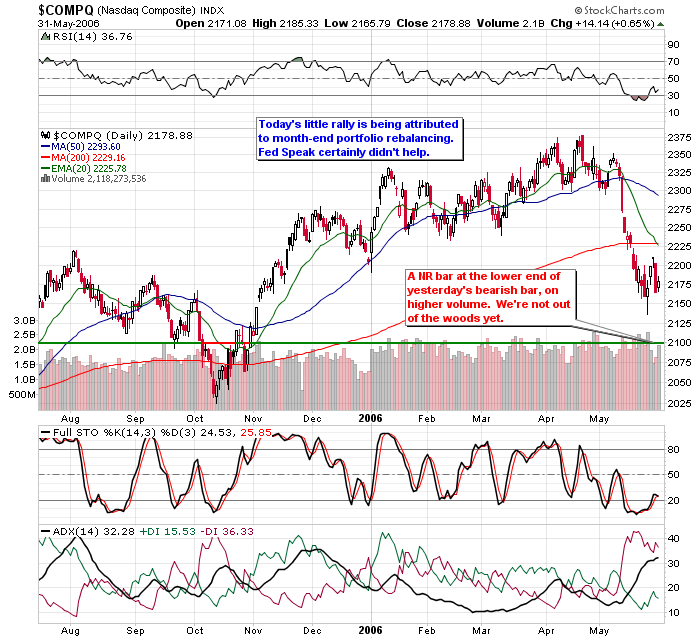
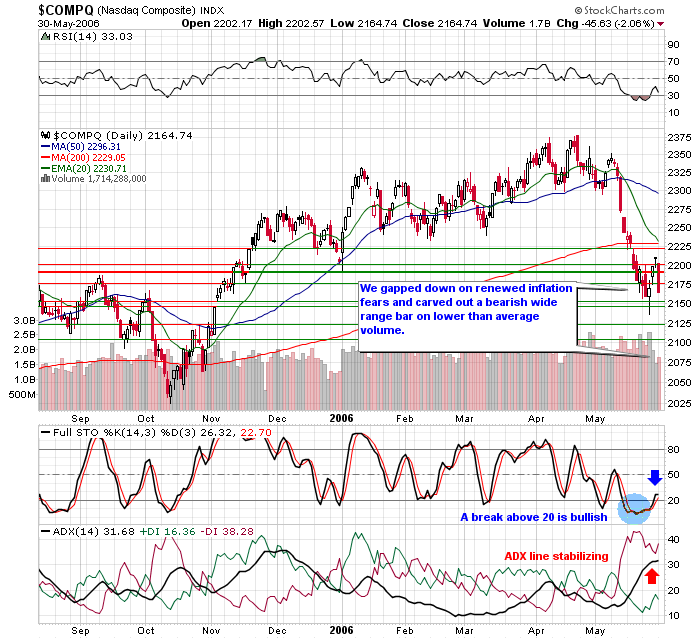 The market gapped down on the open on renewed inflation fears and failed to bounce at any of the key reversal times. By late afternoon selling accelerated and the markets lead by small caps and technology had all given back more than half of last week's three day bounce. All tech sectors ended the day in the red. Only 10 stocks in the NDX 100 ended the session on the plus side and 25 names shed upwards of 3% today, lead by MRVL 5.6%, NIHD 5.1% and SNDK 4.7%.
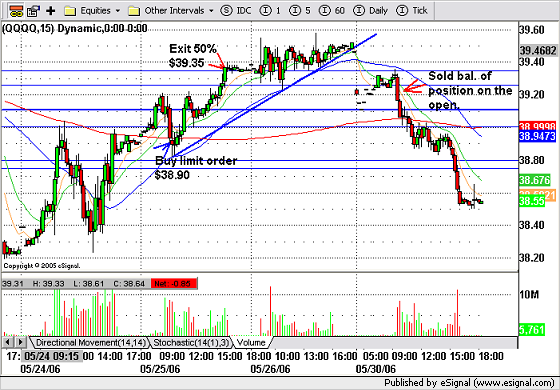 I sold the balance of my QQQQ position on the open because the pre-market didn't inspire too much confidence.
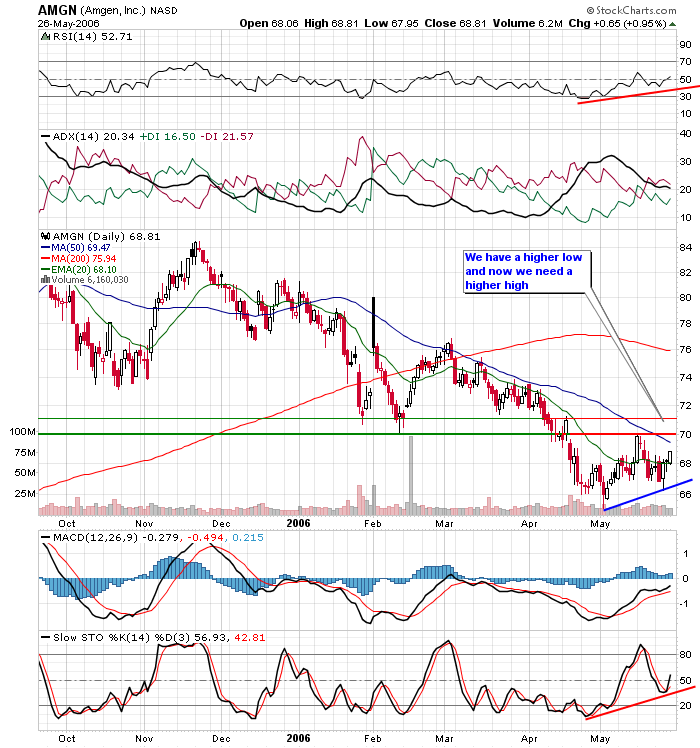 AMGN made a higher low and looks well positioned to challenge recent resistance levels.
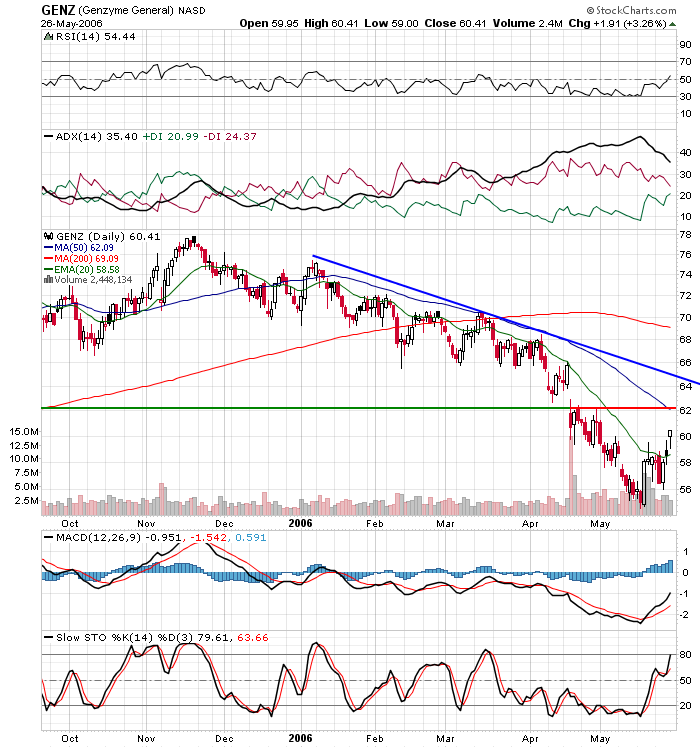 GENZ has room to move higher before running into resistance.
 MYGN has recaptured its trendline and 50 MA and looks well positioned to retest recent highs.
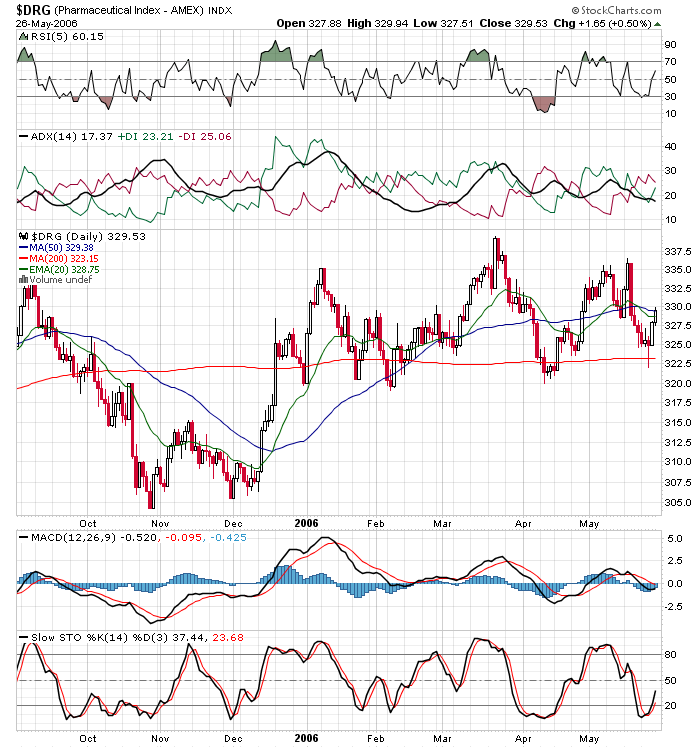
Pharma
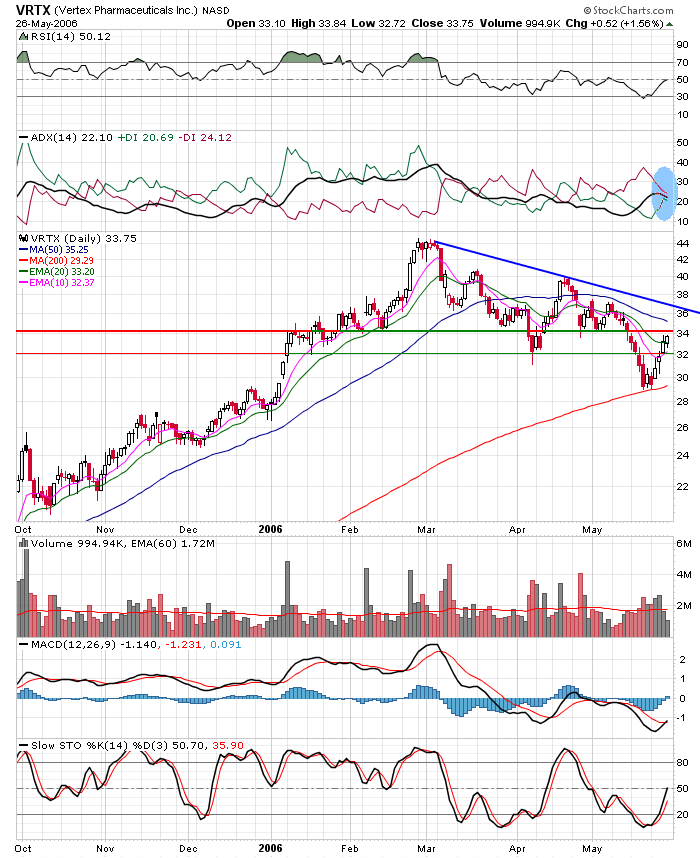 VRTX has had a significant correction and managed to hold its 200 MA. Now it looks like it will test its downsloping trendline.
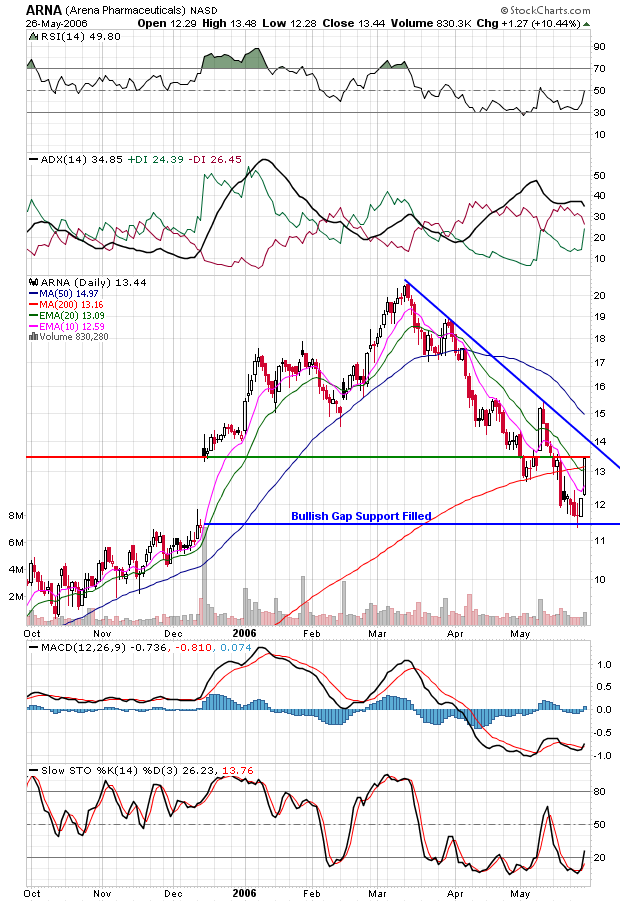 ARNA filled its bullish gap support and bounced back with a lot of momentum.
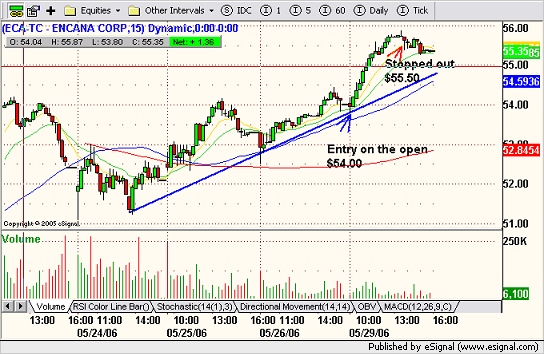 The Canadian markets were open today and they usually don't do too much damage when the U.S. markets are closed. I placed a buy limit order to buy Encana -ECA-TC at $54.00 which was just above the two day trendline. I was filled on the open. At lunch I moved my stop up to $55.50. I was stopped out in early afternoon for a 1.5 point gain.
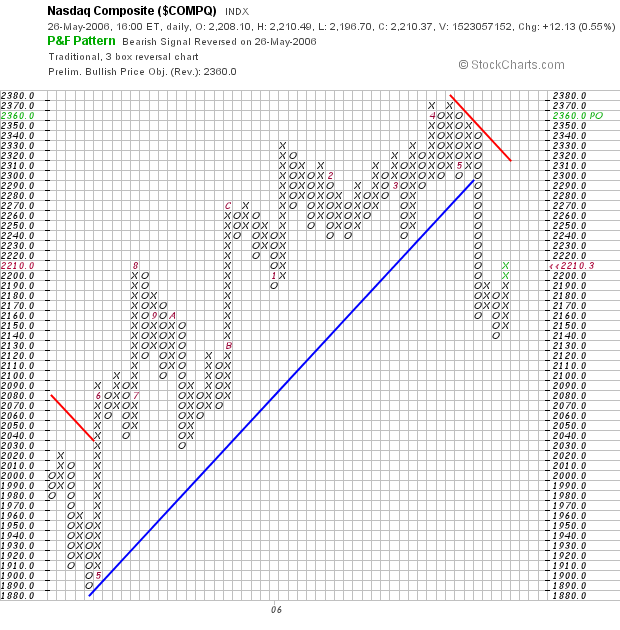
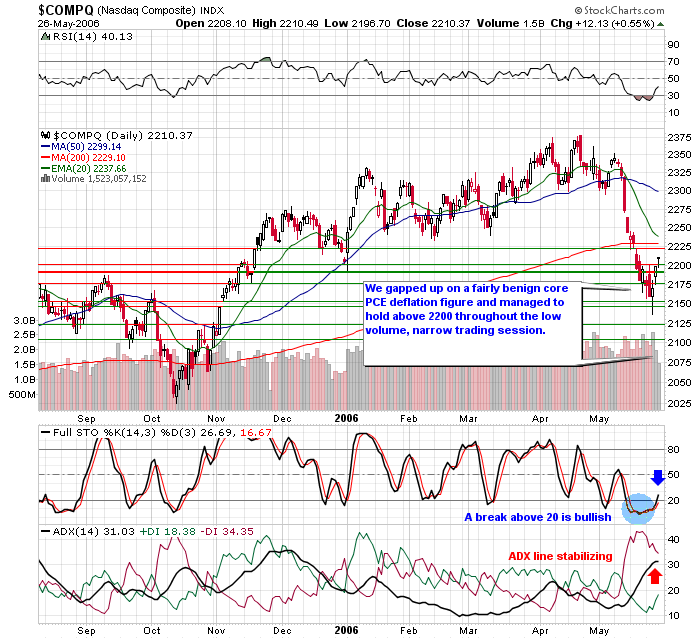
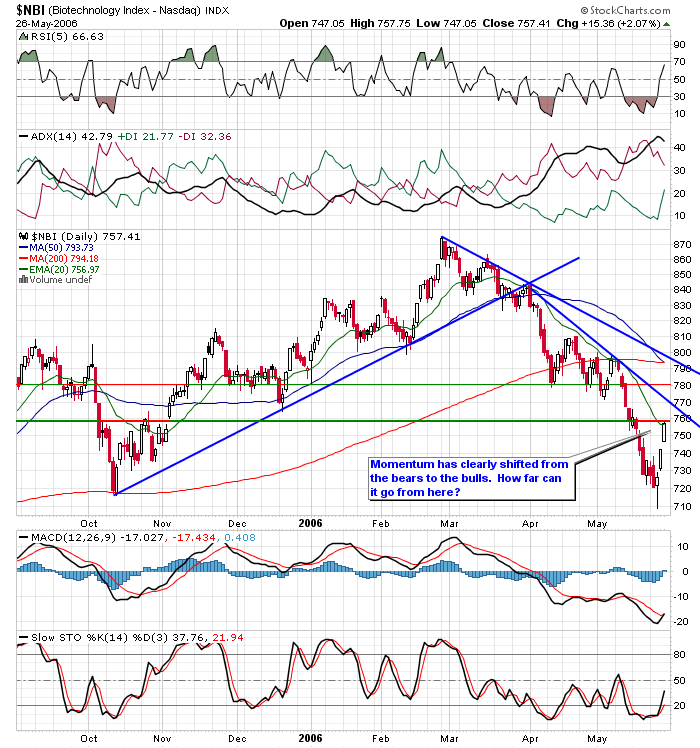
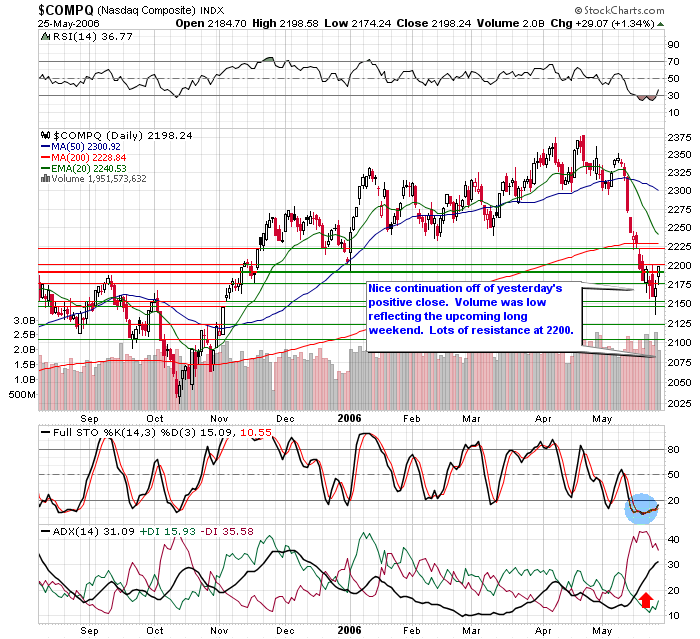 Nice continuation from yesterday's close. The Nasdaq gapped up on the open, pulled in to fill the gap and then moved forward from there. All tech sectors finished the day in the green except the SOX with internet stocks and biotechs taking leadership roles. Commodities and energy also had a big recovery today. We are coming into a lot of resistance at NASDAQ 2200. The NDX winnerss were SIRI, EBAY and AKAM. The NDX losers list includes five semis in the bottom ten - MRVL, MXIM, BRCM, LRCX, and XLNX.
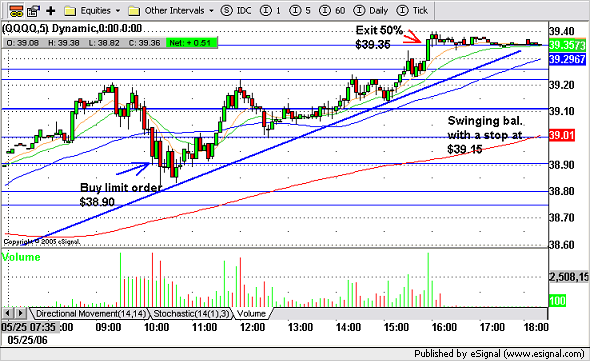 This morning I setup two swing trade buy limit orders before I left for work. The WMT order didn't get filled because I set my price about 15 cents too low. Here is the QQQQ trade which was set well within range. My stop is set to execute only within trading hours.
 click on chart for larger view
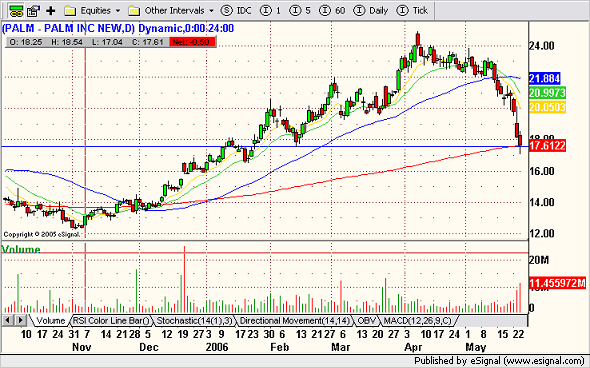 PALM could snap back after this high volume drop into the 200 MA. Look for a potential quick retest of $20.00 before it comes back in.
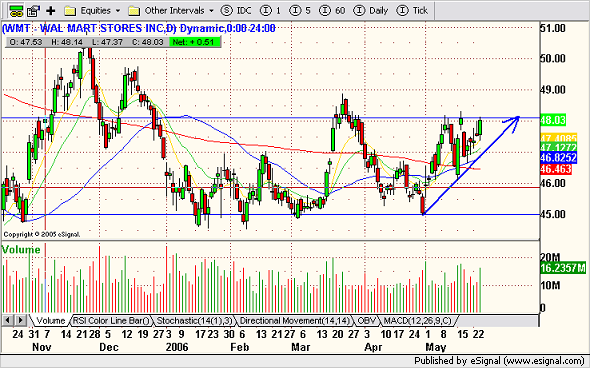 WMT looks like it wants to break higher. Volume has been building to the long side lately and it looks well positioned to go higher in the near-term.
 As mentioned in the swing trade update, CKFR is forming a bearish flag pattern. The short-term target is $48 and the second level target is the 200 day MA around $46.
 CERN was highlighted on Monday's watch list as a potential short candidate because it was taking too long to consolidate. Today it broke out of its bearish pennant pattern for a 6.3% loss. It closed on support but there's still a lot of momentum to the downside.
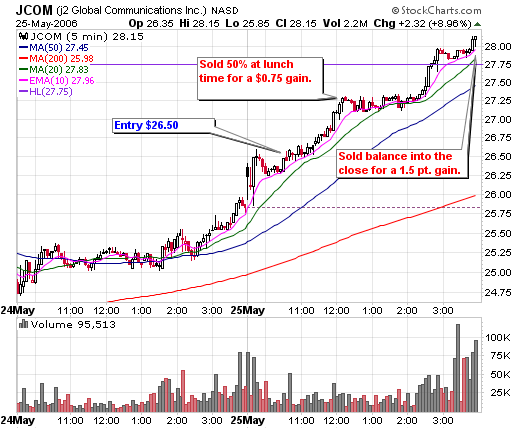
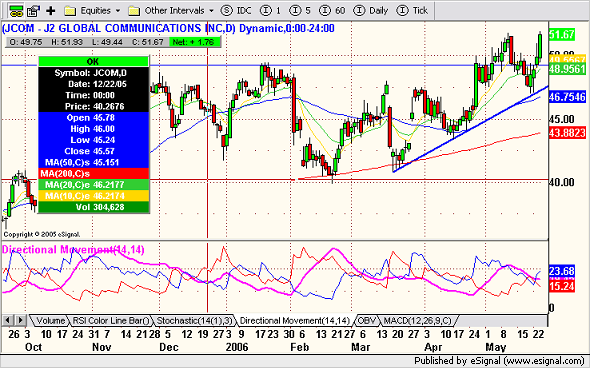 JCOM was on last night's watch list for its strength despite the weak markets. Today it hit another all time high.
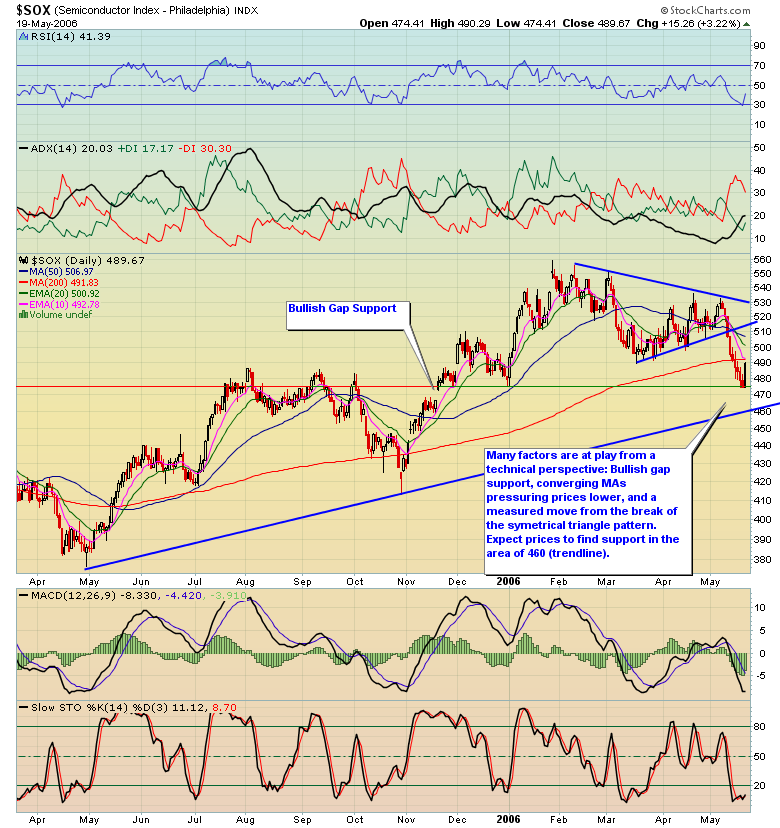
 Some buy interest came back into tech stocks today lead by MSFT which jumped from multi-years lows. It was an up and down day, but it closed on a bullish note and much higher volume. The SOX bounced off of its trendline support to close the day in the green. Looks like tech could stabilize here. Commodities and energy stocks are still on the way down. I'm not expecting a big bounce here because there's far too much resistance just above but maybe we can climb back up to the 200 MA in the near-term.
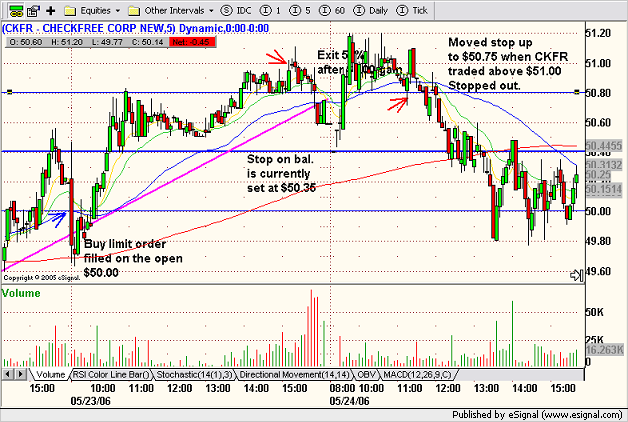 When CKFR moved up above $51.00, this morning, I moved my stop up to $50.75, just 5 cents below support and I was stopped out before midday. CKFR closed just above yesterday's entry point so it was a profitable move. The daily chart looks like a bearish flag pattern is in the works so this could be a good short candidate going forward.
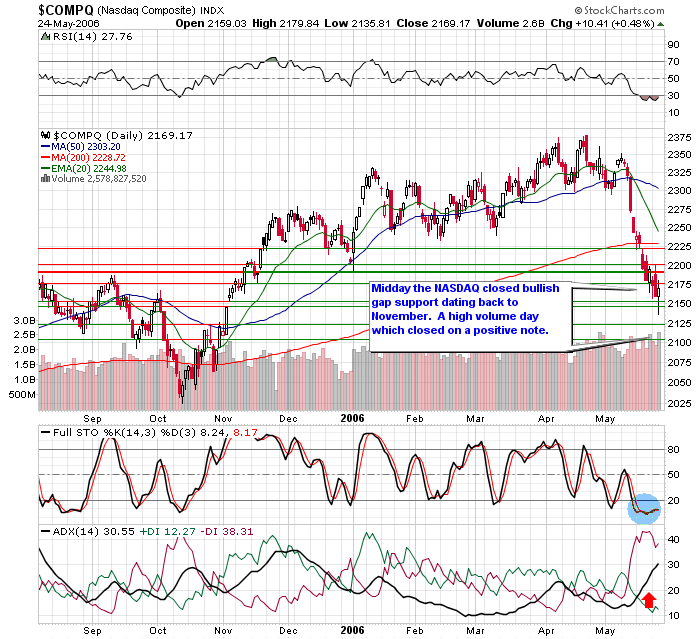
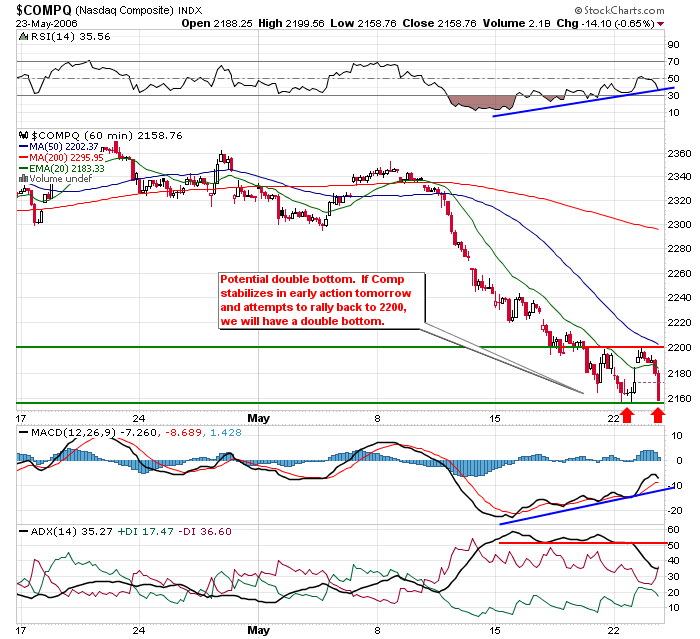 If the NASDAQ can hold support around yesterday's low and bounce back to the 2200 resistance level, we will have a double bottom and a nice base for a potential rally.
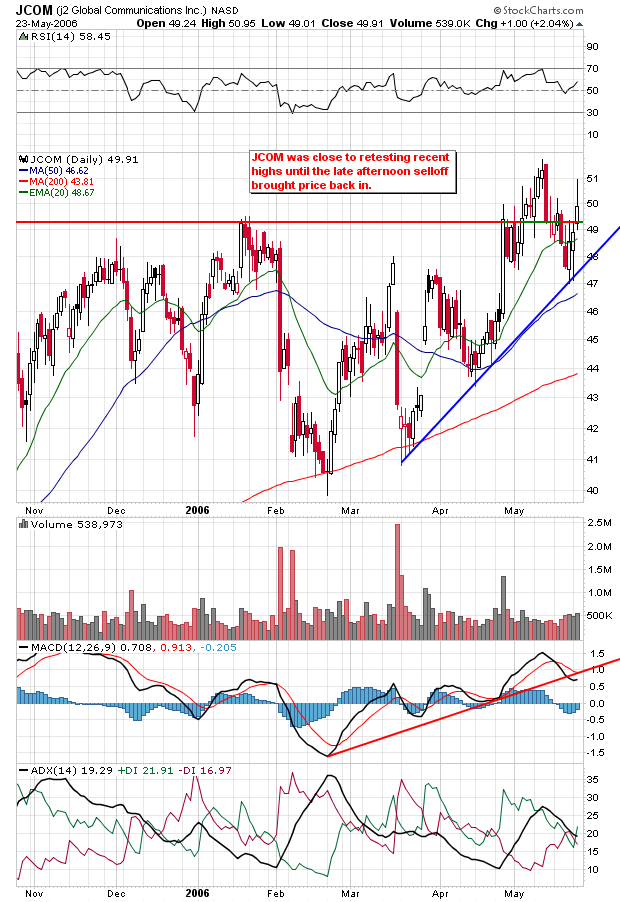 Buy on weakness as JCOM bucks the trend and continues to challenge recent highs.
 Selling pressure is diminishing as volume decreases. Keep an eye on CTXS for a potential reversal.
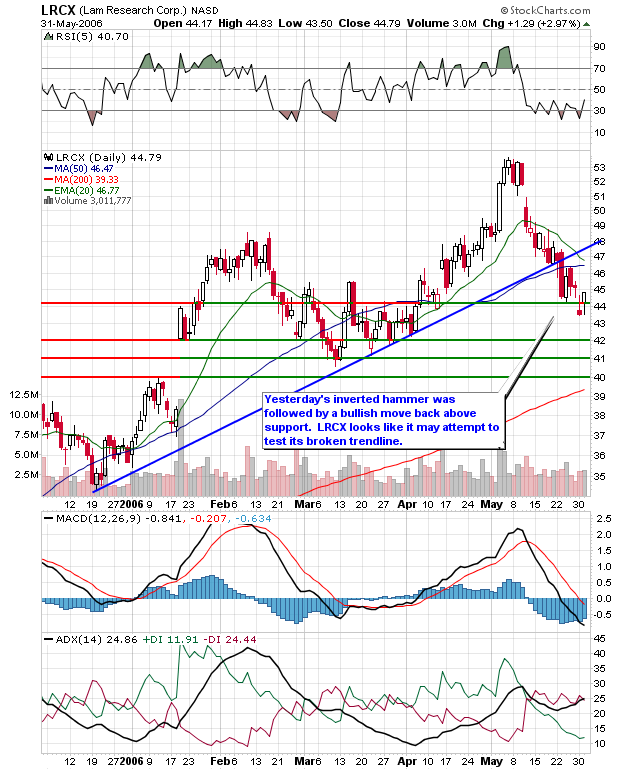
 LRCX had a sharp decline on average volume as investors question their stock option grant policies.
 As I was walking the dog in the park this evening, I overheard some market talk. One guy commented that he thought the selling was over, his friend responded oh no, I just heard on ROB (Report on Business television, Canada's slow motion version of CNBC) that futures were down big time on a bird flu epidemic scare. We'll soon see if this story has legs, but as far as I can tell from reading Briefing.com and listening to CNBC's On the Money, this story is already priced in and overpriced given the details of the close knit family relations of the victims involved.
 My first swing trade setup was CKFR as per last night's watch list. I placed a $50.00 buy limit order around 8:00 a.m. this morning as I was heading off to work. I was filled on the open. At lunch time I placed stop on 50% of my shares at $50.35, just 5 cents below breakout support. I thought that if price could take out the morning high, it could easily go to $51.00, so I placed a sell limit order on the other 50% of my shares at $51.00. That sale went through easily in the last hour of trade. I'm leaving my stop as is going into tomorrow and hoping that the pink trendline holds. Given the sloppy market conditions, I'm lowering my target to $52.00 and hoping to exit the balance of the trade tomorrow.
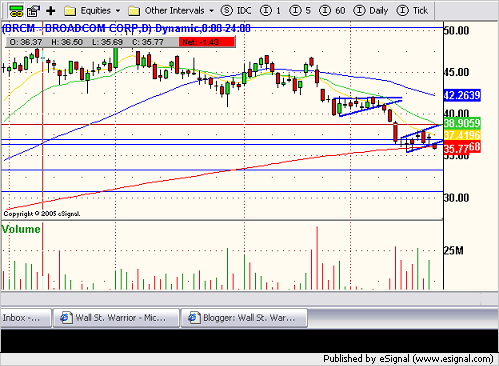
 BRCM took too long to consolidate and eventually rolled over falling out of its bearish flag. Support levels are indicated by the blue lines.
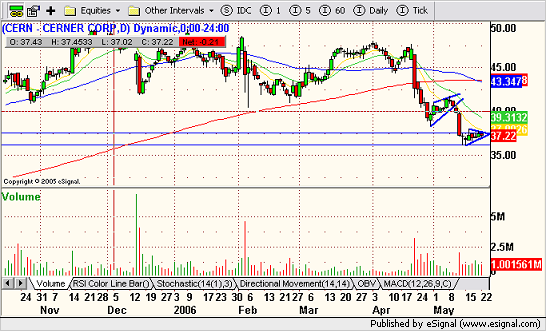 CERN is taking too long to consolidate. Looks like it could fall to the downside on further weakness.
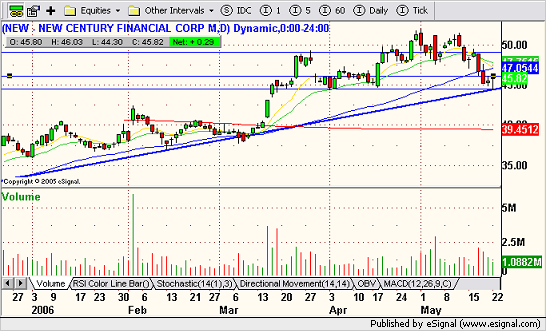 NEW looks like a potential H&S top in the making. We just need a right shoulder. Buy on a confirmed break of $46.06. The swing target is the upper blue line on the chart above.


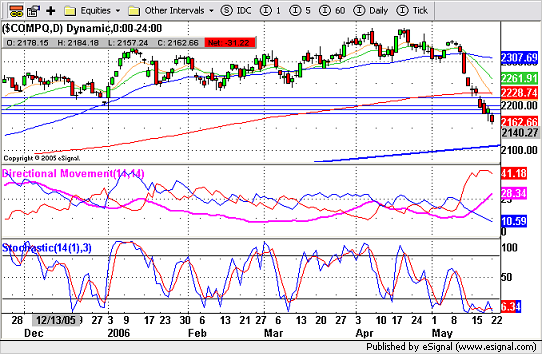
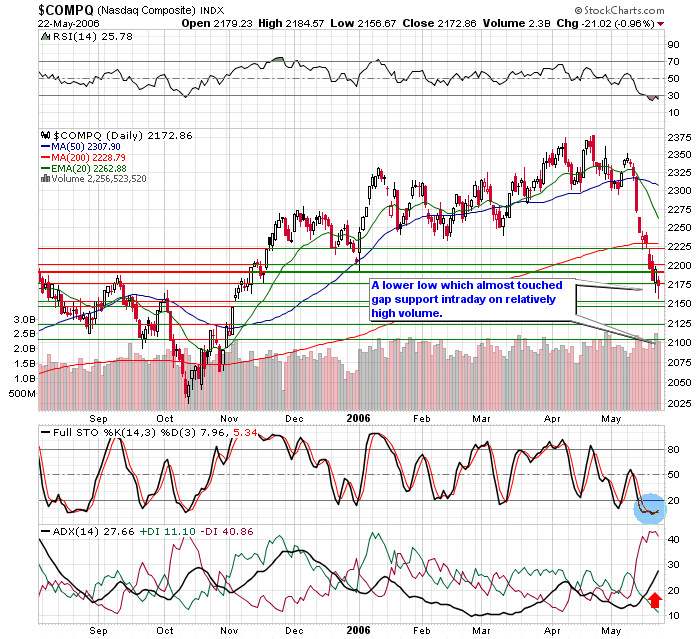 Another day of new lows across the U.S. markets with small caps and tech leading the carnage. Sound familiar? Volume was slightly lower, but still above average. And just when you thought it was safe to tread lightly back into semiconductors (after Friday's bullish engulfing bar), surpise another loss of 4.2%. We have a lot of positive divergence on the NASDAQ 60 minute view, however, we still keep making lower lows. Hopefully we can stabilize soon. Once we stabilize it will be easier to assess which direction to focus on. As it is now, we just keep waiting for a pop that never comes.
Update 1:57 EST - So much for cutting out early. I shorted AKAM at $31.00 and was stopped out at $30.50 for a quick profit. Looks like AKAM has capitulated intraday.
 Click on charts for larger views.
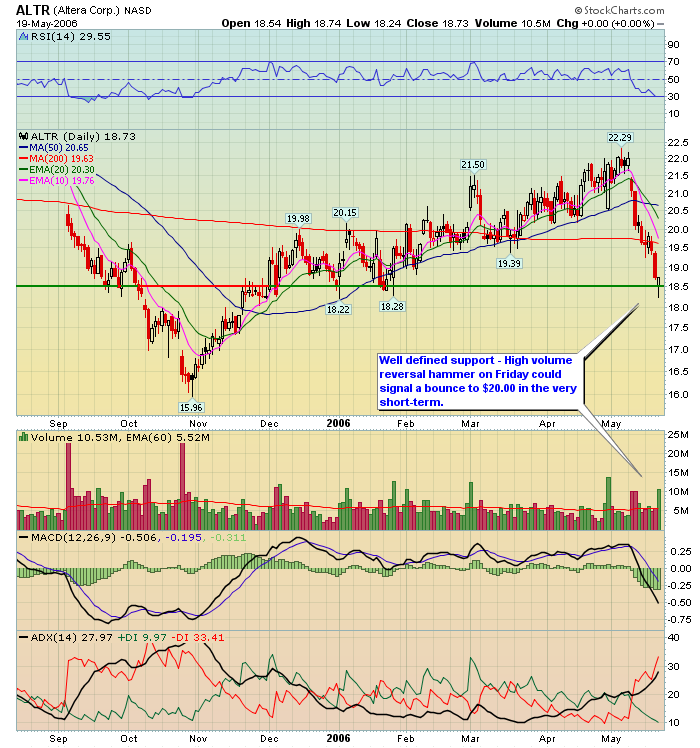 ALTR looks well positioned to bounce from this support area. Friday it carved out a bullish hammer reversal pattern on relatively high volume.
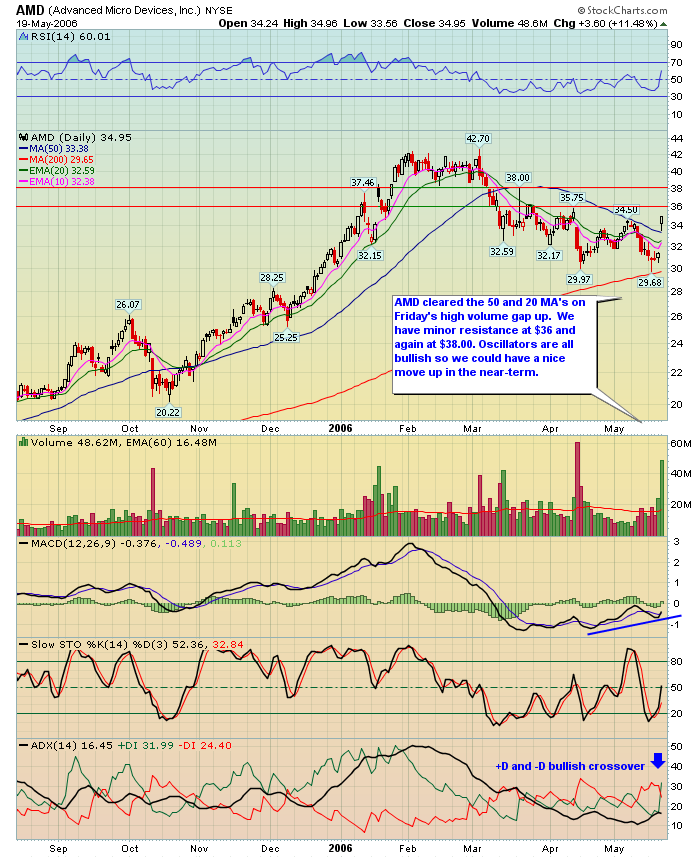 AMD gapped up on very high volume on news that DELL will option their duo core processors beginning next year. In doing so it cleared both the 20 and 50 MAs on a closing basis. We have minor reistance at $36 and $38, but I wouldn't be surprised to see AMD retest $42.00 in the near-term.
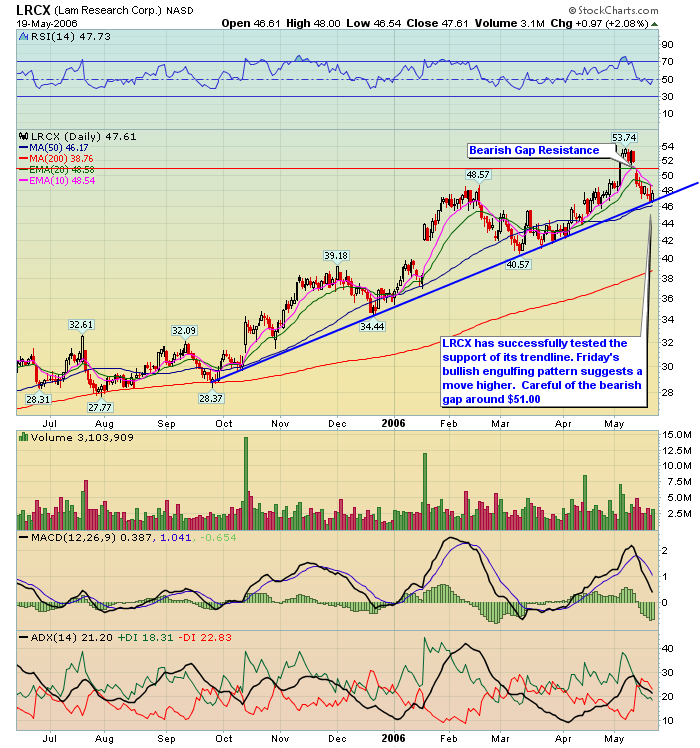 LCRX has successfully tested its trendline and looks well positioned to bounce from here. Friday's bullish engulfing stick could foreshadow a move back up to the bearish gap resistance area in the short-term.
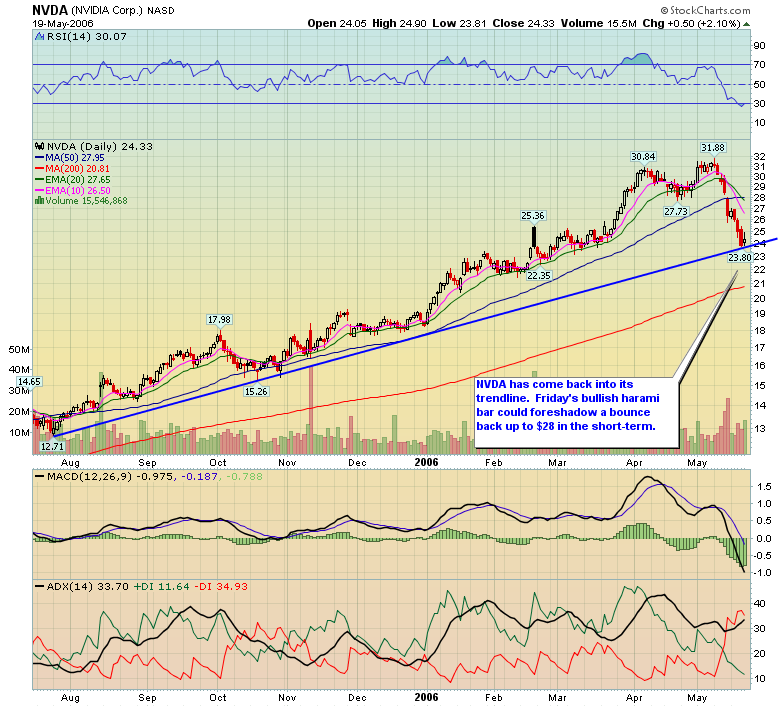 NVDA has successfully tested its trendline and looks well positioned to bounce from here. Friday's bullish harami stick could foreshadow a move back up to the $27-$28 area in the short-term.