Pivot point analysis was first made popular by the floor traders of the Chicago Mercantile Exchange (CME) decades ago. Its widespread use today makes it the number choice by
This trading technique’s basic model calculates two levels of support and resistance and one primary pivot point. The model is designed to work most effectively on high volume trading instruments with a wide daily range.
Basic Pivot Formula
P = (H + L + C) / 3
R1 = (P x 2) - L
S1 = (P x 2) - H
S2 = P - (R1 - S1)
R2 = P + (R1 - S1)
Where P= pivot point; H = high of the day; L = low of the day; C = close; R = resistance; and S= support.
Here is an example using Thursday’s data to manage Friday’s trade for Akamai Technologies Inc. NASDAQ (AKAM):
Symbol | Date | High | Low | Close |
AKAM | 40.46 | 37.81 | 40.29 |
R2 | R1 | P | S1 | S2 |
42.17 | 41.23 | 39.52 | 38.58 | 36.87 |
I have created a simple Excel file to update these on daily basis which involves entering the H, L, and C for each of my watch list stocks on any given day. When I plot the points on my charts, I use the closest visual P, S, and R levels. These are sometimes off by 10-20 cents from the calculated figures.
So enough with the theory, how do we apply this to intraday trading?
I find that these work very well in trading ranges and during tight consolidations within trending moves.
After closing at a multi-year high on Monday, AKAM consolidated its gains for two and half days before breaking out again Thursday afternoon and closing near its highs. This type of momentum is usually followed by more gains on the next open. In order to get an indication of how high we can expect AKAM to trade the next morning, we plot our pivot points on the chart Thursday night based on Thursday’s H, L and C.
As you can see from the chart below, 4 of the 5 pivot points came into play on Friday. R2 was just above the high off of the open. The break of R1 indicated that the pullback would be more than just a minor consolidation and meant that the position had to be sold and a potential short taken by aggressive traders. P was a good place to cover at least 50% of the short position. The doji with the long lower shadow at S1 was good place to cover the balance and initiate a long position as it also coincided with the 7 day trendline.
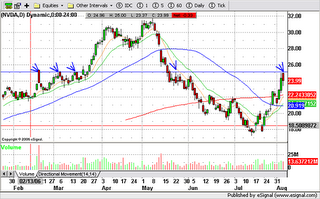
 For longer-term traders and investors, pivot points can also be determined visually without a calculator. A pivot point is a point from which price turns and changes direction. If a specific price repeatedly causes a change in direction it becomes a primary pivot point and should be monitored closely by swing and position traders. Here is an example with NVDA, whose primary pivot point of $25.00 is in play (blue arrows are pivots).
Try the pivot point formula on highly liquid stocks with a minimum price of $20.00 and see if it can help guide you through the intraday price movements. Of course it makes sense to practice this approach before committing actual capital to it. On a personal level, pivot trading has added discipline and confidence to my trading and has eliminated many costly errors.
This post was created in response to a query from student trader Thomas. I know this only answers part of your question Thomas, but it’s a start. In the next chapter I will explain how I find and trade breakout points.

2 comments:
Good post - alot of info.
Thanks X!
Post a Comment