A successful breakout from a low volatility intraday setup will generate a steep, orderly curve over a relatively short timeframe. Consolidations at resistance levels are generally shallow and brief. Excluding consolidations, these breakouts are distinctive in that there is normally little or no overlap of the real bodies of the candlesticks which form the breakout curve. Consolidations should not breach the 10 period EMA on a closing basis. If they do, it’s usually a failure or the end of the move and should taken as signal to exit the trade.
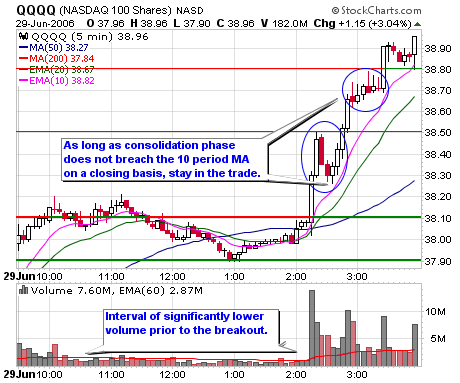
A recent example is the breakout which ensued following Thursday’s Fed announcement. A close examination of the Nasdaq 100 Shares (QQQQ) chart below highlights the main characteristics of the low volatility intraday setup.

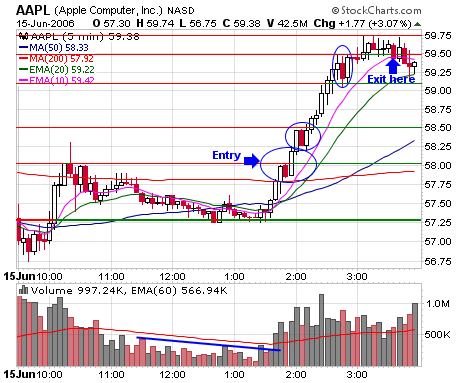
Here are two bullish examples (June 29th and June 15th) with Apple Computer Inc. (AAPL) which is one of my favorite names for this type of setup.

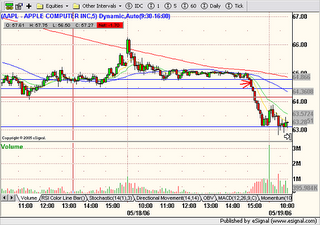
Here is a bearish example again with AAPL dating back to June 18th.
 In summary, the key elements to look for in the low volatility breakout setup are:
1. An interval of low volume, narrow range trade just prior to the breakout;
2. Convergence of moving averages prior to the break;
3. Volume spike on the break and higher volume throughout the move;
4. Steep, orderly curve (60-80 degree angle) - little or no overlap of candlestick bodies except in the consolidation zones;
5. Stay in the trade until the the target is met or the 10 period EMA is breached on a closing basis on the five minute view. Trail a stop just under the 10 period EMA following the first retest of the breakout point.
6. Map out potential support and resistance areas prior to entering the trade so that consolidations don't provoke early exits.
No comments:
Post a Comment