Showing posts with label shooting_star. Show all posts

Monday, January 03, 2011

Technical Picture - Broad Based Gains to Start the New Year

Markets gapped up and broad based accumulation ensued to start the New Year. Both the Nasdaq and the S&P rallied beyond the top of the recent, tight trading channels. After breaching the channels, prices slowly reversed, forming rounded tops intraday. Rounded tops are bearish, implying too much supply, not enough demand at these prices.

I wouldn't be surprised to see a double top develop. Watch the 5 day MA intraday, for support. If a double top forms, we could see some fast selling.

The $USD bounced back today as we discussed last night. That accounts for the weakness in precious metals. Although the greenback failed to hold most of its gains into the close, it stopped the bleeding from last week and manged to close slightly above its 50 SMA.


NQ emini futures trade. Long on break of bull flag. Exit after higher prices fail to print red price bars, indicating a loss of momentum. Wish I had shorted, but was not expecting such a big afternoon slide, given the early momentum.


Early strength was faded, as many commodity names had moved too far, too fast. By EOD we had a lot of bearish shooting stars and doji shooting stars

MIPS broke out and held most of its gains into the close.

Make money in affiliate marketing Click Here!

Sunday, November 07, 2010

Technical Picture - Best Week Since Sept. Surge


Jobs data reported significantly better than expected, but the upside was somewhat limited in the wake of the surge and the rebound in the dollar.

As we can see from the weekly chart of the S&P above, we have cleared the 200 week MA and retraced 61.8% of the 2007-2009 crash ie. ambush zone. We are likely due for some consolidation/corrective action prior to moving to the next resistance level.

Despite extended technicals, there are no short-term reversal signals for the S&P yet.


The USD carved out a lower low on Thursday in the wake of QE2, but Friday's shakeout bar (bullish engulfing pattern) and the positive divergence of RSI to lower prices, foreshadows a reversal. Inversely, the EURO confirms this analysis with a bearish evening star reversal pattern and negative divergence of the RSI to higher prices.

If the $USD bounces here, look for energy, commodities to correct. Also, look for sector rotation with financials set to lead on the upside after finally breaking out of the doldrums.

Technical Setups

LVS extended beyond 100% of the previous impulse leg (A to B) after a minor correction to C. It carved out a bearish shooting star reversal pattern on Friday at point D.

We note that there is no consolidation beyond the earnings gap up day and expect a decisive move back to the 50% retracement level of the last impulse leg up (C to D).

LVS got ahead of itself as we can see from the 15 timeframe below. Price surged out of the channel in morning trade, retested and surged higher still. The last thrust higher saw negative divergence of the RSI signaling the end of the move. The high volume for the day was more on the sell side than the buy side.


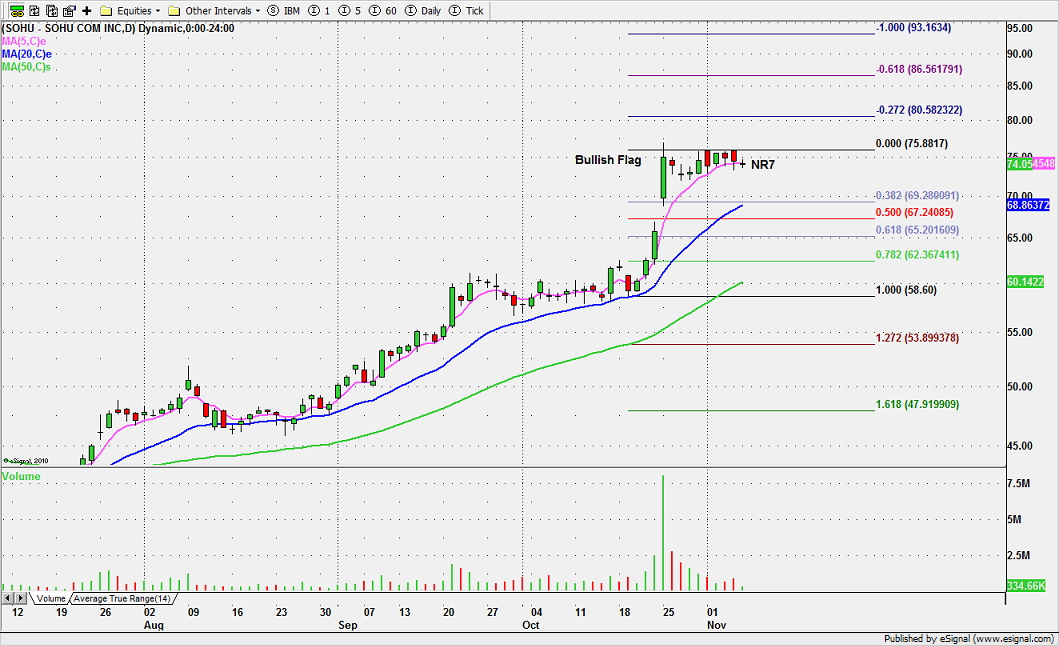
SOHU is flagging and looks poised to break higher very soon. Friday's price/volume action was NR7.

BIIB is also flagging and could benefit from some sector rotation.


Tuesday, June 15, 2010

Technical Picture - Profit Taking at Resistance

Markets gapped up and rallied to the 200 SMA and full retracement of last week's slide. As soon as that widely watched tag occurred, price started to retreat as market participants booked profits. Selling was slow and choppy until Moody's downgraded Greece debt, resulting in an inverted hammer/ bearish shooting star daily candlestick pattern. Overnight, S&P futures retraced 62% of the PDR (previous day's range), currently trading in the ambush zone.

INFY from the Trade-Ideas scanner, gapped and rallied above the daily pivot R2 (blue dotted line). Price consolidated the gap in an orderly fashion. Enter long with target of weekly R2 which matches nicely with full Fib extension.

NTAP - Target 2nd half of full extension of Friday's pattern.

It was important to book full profits before the S&P tagged the 200 SMA because a sell-off was likely. I took half off my POT swing trade on the open. Still holding full NTAP swing trade in the hope that the market does not retest last week's lows.

Friday, December 18, 2009

Day Trade - Potash Corp./Saskatchewan (USA) (Public, NYSE:POT)

$USD vs. Gold still in play; SPX remains range bound. Watch as the greenback and gold approach for a kiss. Will they reverse or will they cross?


A failed setup in POT followed by a long, very tight, narrow range chop finally succumbed to weakness in the last hour after failing to take out the downsloping 20 EMA. The shooting star is the tell.

Wednesday, September 23, 2009

Technical Picture - Sell the News - FOMC Policy

The FOMC finally came out with a more optimistic statement regarding the recovery "economic activity has picked up following its severe downturn", but market participants reacted by selling the news.

The daily SPY chart signals that despite numerous attempts, we can't close above the Lehman gap open. Bearish gaps act as resistance and this one is typical thus far. Today's close is the first close below the daily 5 EMA since early September. The post FOMC sell-off was decisive, so expect that correction I've been anticipating to start now.

The weak dollar has been the major catalyst behind the last leg of the rally. The chart above and below foreshadow a pullback. The dollar looks like it wants to bounce here.

If the $USD bounces, oil will fall out of the box.


Textbook shooting star reversal on the SPY post FOMC. Notice how it retested last week's high, carved out a shooting star and swooned on accelerating volume. Sweet!

RIMM was an ambush setup following early strength (TI momentum scan).

RIMM reports earnings after the bell tomorrow. These are highly anticipated since it broke out of a symmetrical continuation triangle earlier this month. However, the BO volume is lame.

RIMM needs a big beat to justify current price. A big beat will likely complete the gap fill, however, just meeting the expectation will result in a failed pattern.

Monday, August 24, 2009

Technical Picture - Weak Close

Markets extended in early trade. The pullback after the early session move to new multi-month highs reflects weakening momentum with the long upper tail creating a weak candlestick. However, weak stick patterns have been seen several times over the last month or so with no follow through pressure. Watch for consumer confidence data at 10:00.


Initially, it was hard to know which direction POT's narrow price contraction would break. I was prepared to take the trade either way, but since this is one of my weaker WL candidates, I was satisfied with the break lower for a gap fill.

Wednesday, July 22, 2009

Technical Picture - Momentum Decelerating

A slower start on some mixed earnings, but midday the S&P and Nasdaq carved out new highs. The DOW didn't confirm and the markets reversed. But despite the afternoon retracement, the Nasdaq managed its 11th consecutive higher close.

Momentum is decelerating but no clear sell signal. No point in fighting the tape but it really feels overdone. Yesterday's hanging man is unconfirmed until we close below the body, and ideally below the entire stick. Today's candlestick is a spinning top and also foreshadows the end of the move is nigh.

SPY trade - long on break of triangle. Exit at shooting star when price fails to hold $96.00 whole $ level. Short the double top.

GRMN was a HCPG pick from last night's newsletter. Look at the daily and see narrow range consolidation ahead of expansion. The actual trigger was $25.00, but I missed it and waited for price to pause. It's always best to wait for price and the 5 period ema to come into play if you miss the actual BO in early trade.

MOS - bear flag break. I was holding out for an inverse C&H, but MOS didn't want. I guess earnings AH had a lot to do with it.

Monday, June 01, 2009

Focus List Trade - Amazon.com, Inc. (Public, NASDAQ:AMZN)


The markets gapped open this morning on impressive overseas gains and better than expected pre-market spending data. Everything was moving so fast, it was hard to get in. I took a low risk entry on AMZN using the 5 minute timeframe - NRIB at base of round $ level. I exited when it stalled just shy of the 100% FE of the PDL to the base.

AMZN consolidated and managed to rally well beyond the FE target, but it was exhausted and carved out a huge shooting star, setting up a late day short.

A reader asks - AMZN - coiling as MAs converge. What is the importance of MAs converge in general and in AMZN case?

When prices coil at an area of MA convergence, the BO can be extremely powerful as we see from the NKE chart below. Once price broke out of the base, the MAs start to separate like a bow tie.

AMZN looks good on the break of resistance at blue line $80.00 entry point. However, if we look at a wide range view of the daily (last chart), we see a lot of resistance at this level. Normally, the BO of the coiling/MA convergence zone is the best place to initiate a swing trade, but because this rally is long in the tooth, last night we said we don't recommend any new long swings at this time.