Showing posts with label Box_Play. Show all posts

Monday, May 30, 2011

Technical Picture - Markets Edge Up in Quiet Trade

The SPY has managed to fill all of the gaps as it bounced off of the lower channel line. However, there's been a lack of momentum as depicted by the RSI. Without a catalyst, I expect more lackluster trade.

The $USD failed in a attempt to BO of an inverse H&S bottom. This has provided a boost to the commodity trade, but outside of Ags and copper, I'm not seeing much conviction yet.

ES_futures trading higher on a very weak $USD as I write this post.

Stocks Setting Up for This Week

NVLS- NR7 coiling - buy on break of $36.00 for a move back up to the base of inverse H&S pattern, and eventual BO.

Flagging - PETM (above) and ERTS (below). Other bullish flags on my WL are DISH and FL (not depicted).

QCOM has been basing in a tight formation for several weeks. Now that the Bollinger bands have tightened, I expect a BO attempt very soon.

MELI has carved out a symmetrical continuation pattern with strong volume on the upswings within the triangle. This is the most promising setup for a BO long.


RIMM is a box play.

AKAM - positive divergence of the MACD to lower prices foreshadows a trend reversal.

FFIV cleared its 200 DMA on higher volume. Look for price to consolidate in upper range and then BO.

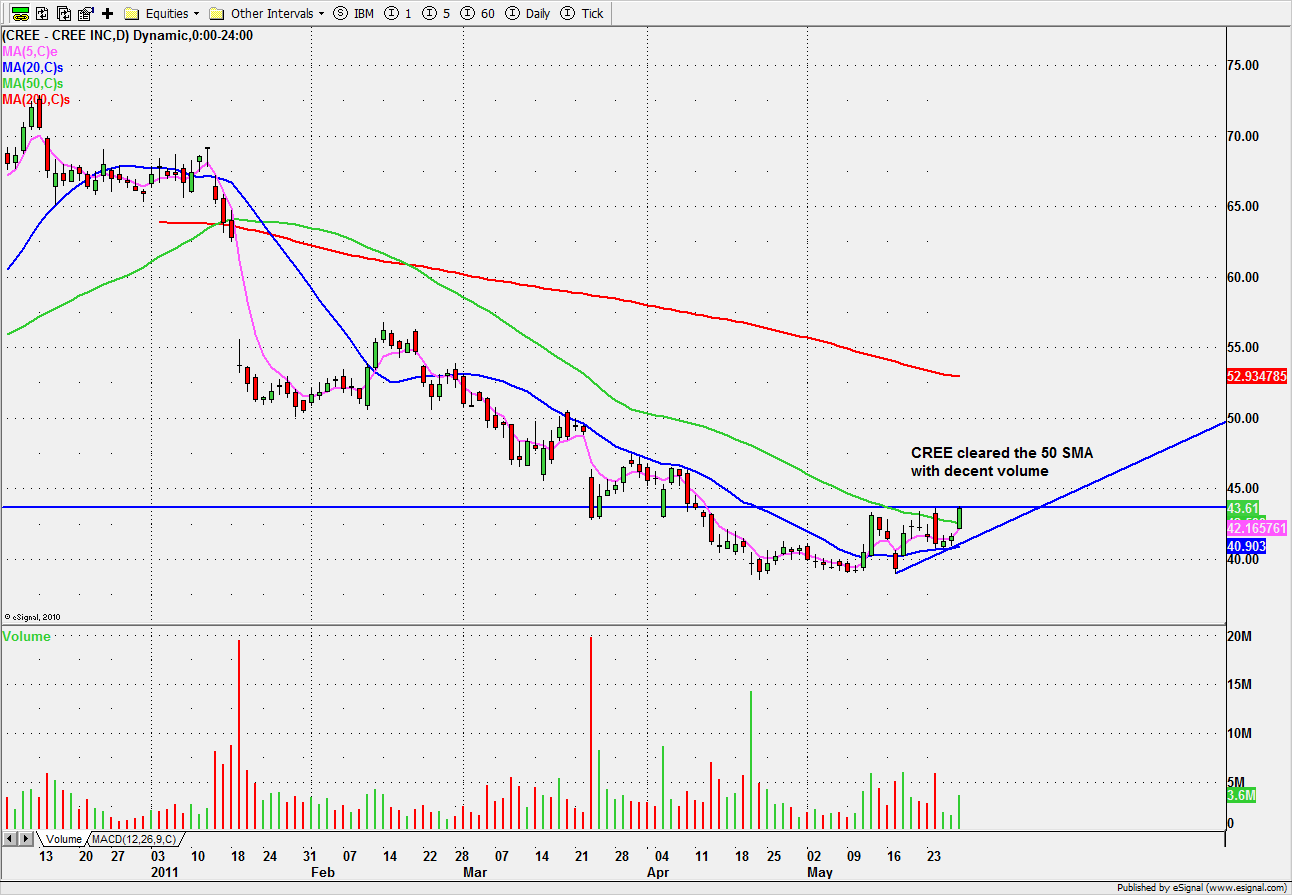
CREE cleared its 50 DMA on decent volume. Base and break.

Tuesday, July 27, 2010

Technical Picture - Laggard S&P captures 200 SMA

The markets extended last week's advance with the laggard S&P finally closing just above its 200 SMA (NASDAQ, DOW and INDU achieved that milestone on Friday.) We've also retraced 50% of the May-June slide.

Biotechs have been pacing the way higher with M&A chatter ( SNY for GENZ). Last week I posted the GENZ daily chart before Friday's BO. Hope you guys caught this one. I traded it Wednesday earnings C&H pattern and again Thursday and Friday. Today I traded BIIB. The takeover is hostile and large caps such as CELG and BIIB are rallying along with GENZ as possible takeover targets if the GENZ deal fails.

AAPL setting up for expansion with 3 NRIBs since the earnings gap. Today's stick is NR7.

NFLX earnings gap extension and an identical trade again today. BOX trade - next test of support should break.

Also watching Ag/chem. POT daily shows price consolidating and could break higher anytime now.

Wednesday, June 02, 2010

Swing Trader - NetApp Inc. (Public, NASDAQ:NTAP)

NTAP is forming a bull flag on the daily (Darvis Box on the 15 min. timeframe below) following last week's earnings gap. The earnings gap accompanied by the volume spike foreshadows higher prices. Swing traders can target full extension on the daily timeframe above when price successfully breaks the highs.


What is the Darvis Box?
Trading strategy developed by Nicholas Darvas in 1956-57. Look for stocks breaking out of a base on huge volume. After the BO, price consolidates in a very narrow range - Darvis box (price/volume contraction ahead of expansion). As price breaks out of the box, enter the trade. Darvis made $2M in approx 18 months using this simple strategy.

Wednesday, October 07, 2009

Intraday Box Trade - Potash Corp./Saskatchewan (USA) (Public, NYSE:POT)


EOD POT looks well positioned to form an inverse C&H. If not, I'll be watching for a double top as this stock is still weak (IMO) despite yesterday's gap.

Tuesday, August 04, 2009

$CAD Weakness -

Last night we said that the breach of support in $USD and breakout in $CAD were suspect because they were unconfirmed by MACD. I was watching $CAD closely intraday and was able to take advantage of the early afternoon swoon in commodities.

That is a gap fill and $USD didn't do much, but keep watching.

This is a 1 minute chart of AEM. Once the MA's crossover above price, pick a spot and get short.

This is a 15 minute chart of POT. Coiling at $97.00 base. Breakout or breakdown, either way, the coiling foreshadows a big move.


Missed the box play in my beloved RIMM. Hope some of you guys were in it!

Tuesday, July 28, 2009

Technical Picture - Range Bound

The S&P carved out two consecutive hanging men in range bound trade. Until either of the two top blue lines on the SPY chart is broken (box play - see ABX example of box play at bottom of this post), the only way to trade is cautiously selling resistance and buying support.

Oil looks like it may be setting up an ambush.


Gold is in play, with a sharp move lower out of a box play. ABX gapped lower and tried to bounce, but couldn't hold the next blue support line.

Saturday, January 03, 2009

Box Trade - Apple Inc. (Public, NASDAQ:AAPL)

A reader asked what is the easiest setup to master. I would have to say that basic chart patterns such as C&H, flags, and H&S along with the box trade are relatively simple setups to execute. I usually look for box trades from my watch list. I look for stocks basing in a narrow range over a period of three days or more. The longer and narrower the box, the more powerful the setup.

AAPL had been basing for 6 days between $84.75 and $88.00. Today it moved out of the R-zone and stair stepped towards the base at $88.00. I usually set an alert inside the base so that I know when to start focusing on the setup. If price moves sharply into the base, it needs to consolidate that move before breaking out, so patience is required to spot the correct entry. AAPL carved out an inside bar (NR7), green on green, which is my favorite for longs.

FWLT had developed a box over the minimum three days. It moved sharply towards the base and retraced 50% allowing for a scaling in, ambush setup followed by additional size after it moved back into the base and printed a tight, narrow handle at $24.00 on the 1 minute chart.

Use Fibonacci as opposed to pivot levels to help plan the exit strategy. The pivot levels are usually tight after a stock has been in a narrow box over several days, so the R2/S2 levels are usually easily taken out.

CELG was a failed C&H pattern. I set my initial stop 2 pennies below the previous (outside) bar low. I eventually tightened the stop as depicted by the red line segment because the setup looked hopeless and I was stopped out. My initial stop would have been been taken out by 1 cent, followed by a reversal and full extension of the measured move of the pattern. Once a pattern fails, it's hard to get back in because you don't trust it anymore.

Sunday, December 07, 2008

Simple Analysis to Understand Fibonacci

The purpose of this post is to review a couple of charts with and without Fibonacci lines so that traders can get a better understanding of the usefulness of Fibonacci as a trading tool.

The first chart is the 15 minute BTU with support/resistance gap openings and congestion zones mapped out.

The second chart is the same BTU chart with the Fibonacci retracement and extensions added. The trade in question was Thursday December 4th. Susan shorted on a break of the coiled spring (price/vol. contraction), partialed at the 50% level and closed at the ORL which lines up with 62% Fib. level. She re-entered after price consolidated at the PDL (previous day low) and exit at the 50% Fib. extension level.

The key take away here is that if the Fibonacci lines are drawn as per Trader-X guidelines (#1) in this setup, the Fibonacci retracement zones (38%-62%) correspond to key S/R, congestion areas. Those are areas where price could typically find support and consolidate or retrace. If you're trading in the retracement zone, you have to manage the trade closely. Once price moves away from the retracement zone, and assuming the setup is good, it is more likely to move to the next level because there's nothing in the way.

Fibonacci lines are a mathematical tool to help traders with entries and exits. It's much easier to map out Fibonacci lines than all of the actual S/R, gaps and congestion zones. The math, which is not my forte, has an uncanny way of lining up with the key spots.

In addition to the guidelines set out by Trader-X, I have a few of my own. Long time readers know that when I trade chart patterns, I like to place Fib. extension lines from the high/low of the pattern to the base. For example on a C&H, I extend from the low of the cup to the base of the handle and target 100% extension. That's based on textbook measured moves of chart patterns.


The chart below of ABX (TSX) is a 3 PP base - box play. In this type of setup, I prefer to place my Fib. lines from previous day high to the pivot point base rather than the ORL. Why? Because the base has been forming over several days and is thus more significant than the open.

Here again I've mapped out the real S/R zones and Fibonacci. They're almost identical. I traded ABX on Friday as depicted below. On the first test of the R-zone, it held as resistance and price moved to the 100% extension. I had planned to short again if and when it broke out of the retracement zone to the downside around 2:30, but that didn't happen and I moved on to something else.


This post has been selected for Dinosaur Trader's annual Best Stock Market Blog series coming soon!