Showing posts with label NR7. Show all posts

Thursday, January 12, 2012

NR7 - Market Test Your Scan with OddsMaker

We've been in a mean reverting market for almost a year and long breakouts are few and far between. Long setups that worked well in 2009 and 2010 had little chance of success last year. If that sounds familiar, you need to refine your trade setups to the reality of the current market environment.

One of my favorite setups is the 15 minute NR7 which reflects price/volume contraction ahead of expansion. I like to trade NR7 with stocks showing intraday momentum. NR7 is a great trading strategy to deploy during earnings season. Earnings gaps offer good trading opportunities but we don't want to chase. Wait for NR7 and catch the next leg with low risk.

Using Trade-Ideas Pro Scanner 3.1 in conjunction with OddsMaker, I am able to market test under current conditions and refine my NR7 scan to generate a winning strategy.

As depicted below, my scan generates a 27.7% win ratio. That may not sound like a lot, but since I use a tight stop, losses are small and winners generate good income over a short period of time. The OddsMaker quickly market tests my NR7 scan and provides summary and detailed results of the strategy over the selected number of days of back testing. In this sample, I used 500 share size for all trades and after 15 days it generated $4,000.00. Even if we reduce the maximum number of trades possible on any given day, the results are still impressive, given that my testing assumes that all trades are closed after a $1.00 profit is attained.


My NR7 scan starts with a preview of stocks gapping up in pre-market and then alerts me of NR7 stocks that meet the criteria in real time as depicted below. If you want the exact configuration of this scan click here.

A couple of sample NR7 trades are CROX on Jan. 11 and SINA on Jan. 12.


Identify a trading strategy that works well under current market conditions and then let OddsMaker back test and crunch the numbers. All you have to do is refine the scan and trading rules to enhance the results and make the strategy manageable.

For more info check out the Trade-Ideas blog.

Sunday, October 30, 2011

Gap Momentum with NR7 - FEIC

High volume gapping stocks offer good trading opps if you can sit on your hands until a good setup presents itself.

There were two trading opps for FEIC on Friday.

  1. Fib retracement long - red fib lines where you should target the 23.6% FE. I missed it. After coming within 10 cents of the FE, price consolidated in an increasingly narrow range, which we identify as coiling ahead of the next leg up.
  2. Within the coil, we spot the NR7 bar and place a long entry, using a few cents below the low of the NR7 as the stop.
Related post - NR7

Monday, May 30, 2011

Technical Picture - Markets Edge Up in Quiet Trade

The SPY has managed to fill all of the gaps as it bounced off of the lower channel line. However, there's been a lack of momentum as depicted by the RSI. Without a catalyst, I expect more lackluster trade.

The $USD failed in a attempt to BO of an inverse H&S bottom. This has provided a boost to the commodity trade, but outside of Ags and copper, I'm not seeing much conviction yet.

ES_futures trading higher on a very weak $USD as I write this post.

Stocks Setting Up for This Week

NVLS- NR7 coiling - buy on break of $36.00 for a move back up to the base of inverse H&S pattern, and eventual BO.

Flagging - PETM (above) and ERTS (below). Other bullish flags on my WL are DISH and FL (not depicted).

QCOM has been basing in a tight formation for several weeks. Now that the Bollinger bands have tightened, I expect a BO attempt very soon.

MELI has carved out a symmetrical continuation pattern with strong volume on the upswings within the triangle. This is the most promising setup for a BO long.


RIMM is a box play.

AKAM - positive divergence of the MACD to lower prices foreshadows a trend reversal.

FFIV cleared its 200 DMA on higher volume. Look for price to consolidate in upper range and then BO.

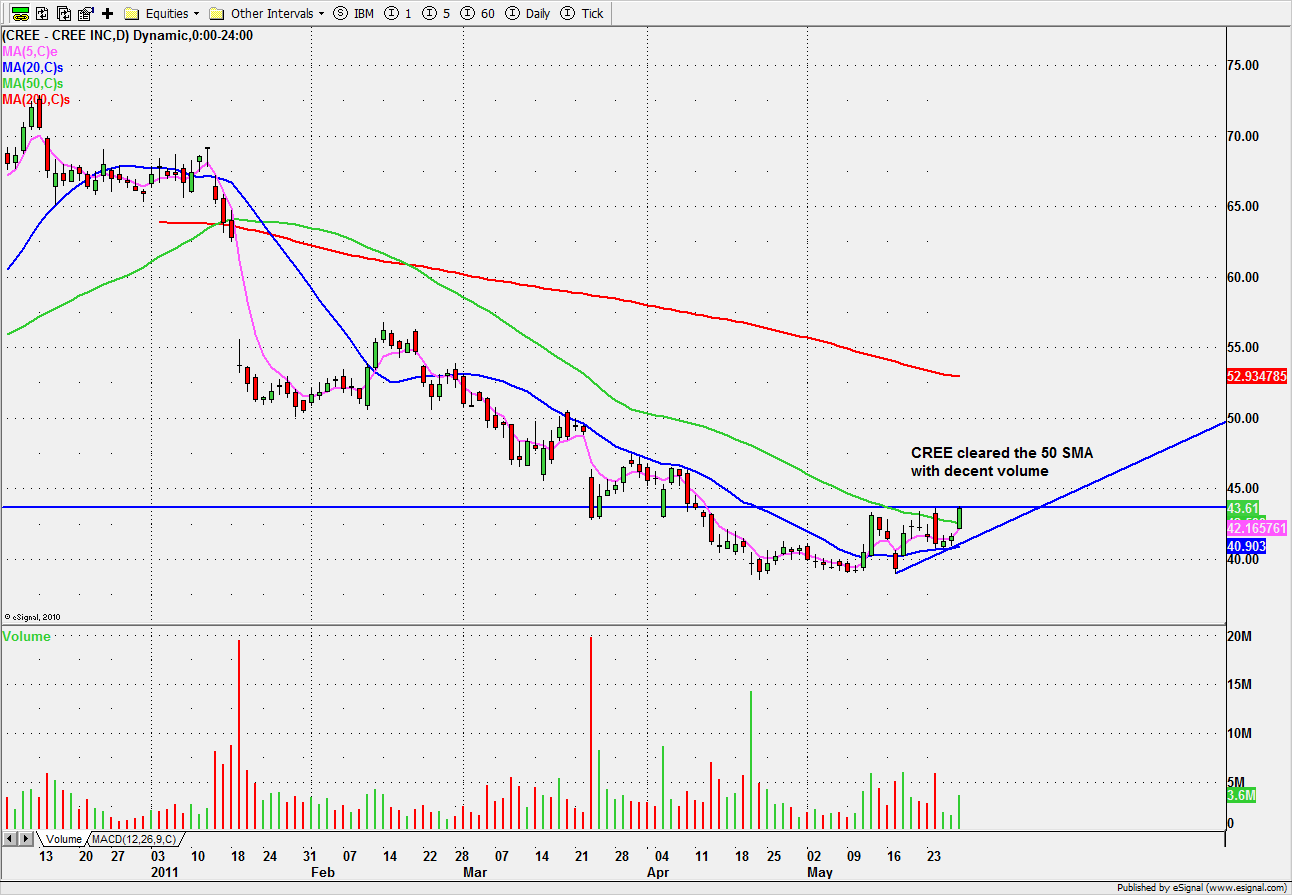
CREE cleared its 50 DMA on decent volume. Base and break.

Tuesday, May 10, 2011

Tecnical Picture - Bounce Extends

The market has retraced 62% of last week's slide on lighter volume. As depicted on the the 5 min. chart of e-mini futures below. Last Friday's jobs report gave us a wide gap, but formed a bearish rising wedge which eventually led to a complete gap fill. Monday's action was inside, and today we were finally able to extend beyond Friday's high.


SLV has filled the bearish gap more or less, but the bounce has been lame in terms of time and volume. It took three sessions to retrace one day's losses. Very choppy intraday action - not my cup of tea.

USO has retraced 38% of its slide, but needs to push up to 62% in order to fill bearish gap.

$USD is consolidating after breaching downsloping trendline.

Most of my morning trades were scratches but the afternoon trades turned things around. I have been keeping an eye on RIMM's decent. Today, it breached $44.00 for a minute or two and then snapped back - head fakes usually lead to good trades in the opposite direction.

RIMM is technically oversold (daily RSI below 30) and was a good candidate for an oversold bounce (short squeeze).

Enter long on break of NR7 following head fake. See the volume spike as price takes out the obvious resistance levels (blue lines). This is where the stops get triggered and the squeezes occur. Keep on WL for follow through.

CTSH looks well positioned for an attempt at a gap fill following last week's earnings gap.

Saturday, April 30, 2011

Technical Picture - Modest Gains on Higher Volume to End the Month

Markets opened somewhat mixed, with the DOW outperforming on the strength of solid earnings from CAT and MRK, whereas the NASDAQ lagged following disappointing reports from RIMM and MSFT. Still, we managed to close positive across the board on higher volume. Leaders included solars, semis, coal, GLD, MOO, airlines and energy. Biotechs saw profit taking after an extended run.


Some of the companies reporting earnings the week of May 2nd-6th:
  • Monday: ACV, AB, CPO, DISH, SATS, JKS, APC, DVA, DNDN, FMC, FST, HOLX, and NETL
  • Tuesday: ANR, ADM, AVP, BZH, BYD, BPI, CLX, CTSH, INCY, LM, MA, PCS, MYL, OSG, CBS, CEPH, CRL, CMCSA, DENN, GNW, KNXA, MAKO, OPEN, VCLK, WWWW, and AUY.
  • Wednesday: ASCA, AOL, CLH, GRMN, HNT, K, GAS, NUS, OIIM, PCG, SLGN, BEBE, CMO, CECO, CLWR, ERTS, GG, GDP, IPI, LEAP, PRU, SMSI, TSLA, and WFMI.
  • Thursday: CVC, CBOE, DTV, RAIL, GM, MINI, MNTA, OWW, PXP, RDN, SHOO, TBL, THS, VNDA, VC, WNR, JOBS, NILE, CQB, DEPO, FLR, HANS, KOG, JCOM, KFT, LLNW, PWER, PCLN, RNWK, V, WBMD, and WMGI.
  • Friday: CAS, DSX, ZEUS, PNM, UPL, WTW, and WCG.

The $USD is in a free fall versus GLD and SLV which are parabolic. We should get a technical oversold bounce in the $USD any day now. This is not likely a bottom because there's no positive divergence to indicate an imminent reversal.


By the same token, GLD is due for an overbought technical correction, similar to what we saw in SLV early last week.


Last week's correction in SLV provides us a preliminary support level.

Coal is breaking out of a tight congestion area.

Day Trades

OXY - HCPG pick - favorable earnings was the catalyst for this high volume extension. I waited for a NRB before jumping in.

DRIV - A narrow range coil triggers the short entry. Came within 5 cents of a stop out, but by EOD, my target was reached.


RIMM was a gap down on earnings warning. After the opening range, price couldn't move beyond the 50% Fib. retracement level and eventually broke the trendline for a low risk short.

I covered half when I saw some real size on the bid side at the $48.50 level.


AMRN printed NR7 on Friday. Watch for price expansion.

Wednesday, April 20, 2011

Technical Picture - Tech Leads Markets Higher with Huge Gap

The markets gapped up sharply on the heels of good earnings from tech bellwether INTC +7.8%, as well as VMW, JNPR, and YHOO... Not much in the way of extensions for the indices, but only limited selling pressure off of the mid-morning highs.

After hours we got more favorable tech earnings from FFIV, QCOM and AAPL. Markets are extended very short-term.


There's a lot of talk about SLV being way overextended, but so far, it has managed to stay within its rising channel. I am waiting for a huge gap open which takes price beyond the upper channel line and well beyond the upper BB, setting up a short. We may get that tomorrow as SI_F is trading at $45.62 as I write this post.

This is a chart of AAPL post earnings. The profit taking in the second half of the after hours session is somewhat suspect. Will be interesting to see which support level will hold, if any?????

Day Trades

ALXN - Low risk, long entry ahead of earnings tomorrow morning.

RVBD - Support was holding and I couldn't resist the low risk setup.

NTES - Failed breakouts yesterday for NTES and SOHU set the stage for today's weakness. Another NR7 (low risk) setup.

Thursday, March 31, 2011

Technical Picture - Consolidation - Markets Mixed

The markets consolidated ahead of tomorrow's jobs data and in the wake of the big move from the March lows. The DOW and S&P had minor losses whereas, the NASDAQ and Russell printed minor gains. As depicted on the chart above, we are testing the top of the congestion zone which formed prior to the correction. Normally, we would expect matching or similar congestion areas to form prior to breaking higher. If that's the case, we need to consolidate through price and not just time.

Normally, strong jobs data leads to higher interest rates and pressure on gold. The GDX chart below shows that we are on the cusp of breaking out of a symmetrical triangle. How does it work? Well, strong jobs data suggest the need for continued QE (quantitative easing) by the FED, may be coming to an end, sooner than later. Whisper numbers are always higher than consensus, so this is always tricky.

Day Trades

TSLA gapped up, and flagged into the rising 5 period EMA on the 15 min. timeframe. As we can see from the daily chart above, we had two targets, gap resistance and gap fill. I took a partial at resistance and was stopped out on balance. Eventually, formed a bearish base, which I shorted.


Early weakness in RIMM formed a bearish flag near daily support which I shorted hoping for a BO, but there was a huge buyer lurking around $56.85. The trade was aborted when price formed a base just under the flattening 5 period EMA. Just like the APOL trade from a few days back, the failure sets up a long entry. The next test of this level should break.

From the daily chart above, we see that a measured move of the bear flag pattern would bring prices down to $50.00, a solid support zone.

DECK - not a winning setup, but I was hoping that the bear flag would break and extend to the low end of the congestion zone.


VRUS was a momentum gap. Price rallied, retraced and consolidated, forming a base and setting up a low risk entry (NR7). VRUS is blue sky, but on a measured move basis, it should top out between 80 and 81, and consolidate.