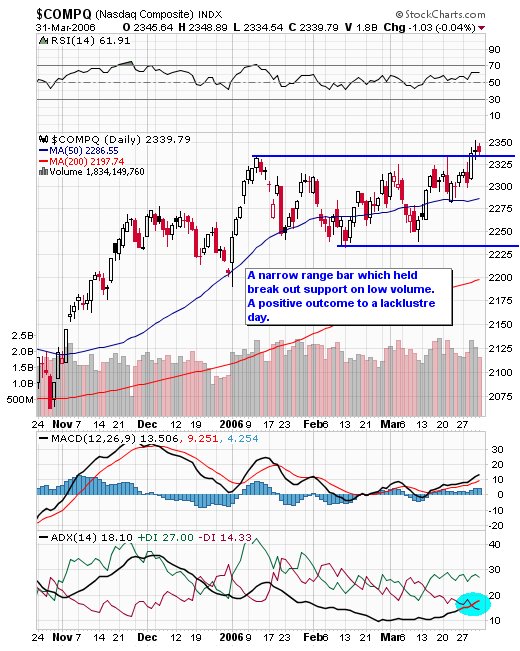
 Like yesterday, the advance stalled at 10:00. For the most part, today was a lacklustre day as characterized by lower volume, a narrow range bar, and the loss of just 1 point. The only positive take away is that we held breakout support at the end of the quarter. The SOX was down 1.2% due to institutional selling of weak sector names like SNDK, KLAC, MRVL, XLNX and AMAT. Today's NDX winners were CTXS, LBTYA and EXPE.
Friday, March 31, 2006
Nasdaq Technical Picture
Like yesterday, the advance stalled at 10:00. For the most part, today was a lacklustre day as characterized by lower volume, a narrow range bar, and the loss of just 1 point. The only positive take away is that we held breakout support at the end of the quarter. The SOX was down 1.2% due to institutional selling of weak sector names like SNDK, KLAC, MRVL, XLNX and AMAT. Today's NDX winners were CTXS, LBTYA and EXPE.
Trade of the Day - AKAM
 AKAM was good to me this week. Purchase on break of yesterday's high with 50% profit locked in at the 10:00 reversal time. I had to leave my desk so I set my stop on the balance of the trade just below the pre-market low (a calculated risk given the strength of the stock so far this week). I was able to pick up some more on a volume spike in the last half hour (this last trade was taken on a 1 minute chart). Surprisingly, it took out $33.00 and I was stopped out on the entire position when it came back in.
In Play
BLKB long
Watch AKAM for a break of consolidation high
Update: Long AKAM on break of yesterday's high
50% profit booked on BLKB. Not enough volume to support the breakout - tight stop.
I have to leave and will not be able to update the blog during the trading day.
Good Trading!
Watch AKAM for a break of consolidation high
Update: Long AKAM on break of yesterday's high
50% profit booked on BLKB. Not enough volume to support the breakout - tight stop.
I have to leave and will not be able to update the blog during the trading day.
Good Trading!
Pre-Market
NDX futures and QQQQs are hugging the unchanged line.
A few noteworthy items for some of our watchlist stocks courtesy of Briefing.com :
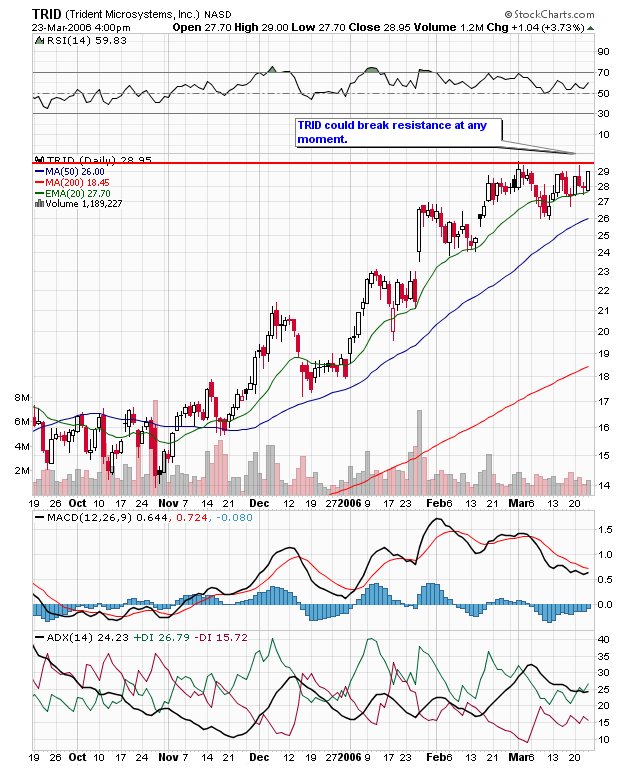
TRID - Amtech notes that GNSS pre-announced the March quarter, guiding revenues to $60-61 mln vs $62-67 mln. They say the shortfall was attributed to weaker than expected demand for flat panel TV controllers in Europe and for digital CRT TV controllers in China. Firm would be buyers of both TRID and OIIM on weakness due to ‘guilt by association.' They believe that GNSS O.E.M. customers (LG, Toshiba, Philips) are losing share to TRID O.E.M. customers (Sony, Sharp, Samsung). Additionally, they think TRID could see upside potential from penetration in tier two O.E.M.s and O.D.M.s. As such, they continue to believe estimates will move up through the year. Despite the miss, they say GNSS did comment that LCD monitor demand was in line with expectations (flat q/q) and thus increases their conviction that concerns over OIIM monitor inventories are overdone. They note that as recently as last week, OIIM management reiterated that the monitor problems from Q4 have not resurfaced.
NVDA - Digitimes reports Nvidia on March 30 announced a new line of Nvidia Quadro FX graphics solutions, the Quadro FX 350M, 1500M, and 2500M, for mobile workstations, which will be incorporated into Dell's Precison M65 and M90 workstations. Nvidia Quadro FX mobile solutions offer the same features found in Nvidia workstation graphics solutions for desktop-based professional workstations, stated the company. These include exclusive features like 12-bit sub-pixel precision and full 32-bit floating point precision, noted Nvidia.
AKAM - Prudential expects another strong quarter out of Akamai driven by high levels of media traffic, particularly video. Firm raises their 1QE revenue and EPS ex-option expense to $87.1 mln and $0.17 (consensus is for $85.3 mln and $0.16) and their 2006E revenues and EPS ests to $371 mln and $0.73 (consensus is for $363.9 mln and $0.71). Given higher demand they are slightly increasing their capex forecast to 14% of revenue, putting some downward pressure on free cash flow. Despite continued strong business trends, they believe the stock has gotten ahead of itself.
A few noteworthy items for some of our watchlist stocks courtesy of Briefing.com :
TRID - Amtech notes that GNSS pre-announced the March quarter, guiding revenues to $60-61 mln vs $62-67 mln. They say the shortfall was attributed to weaker than expected demand for flat panel TV controllers in Europe and for digital CRT TV controllers in China. Firm would be buyers of both TRID and OIIM on weakness due to ‘guilt by association.' They believe that GNSS O.E.M. customers (LG, Toshiba, Philips) are losing share to TRID O.E.M. customers (Sony, Sharp, Samsung). Additionally, they think TRID could see upside potential from penetration in tier two O.E.M.s and O.D.M.s. As such, they continue to believe estimates will move up through the year. Despite the miss, they say GNSS did comment that LCD monitor demand was in line with expectations (flat q/q) and thus increases their conviction that concerns over OIIM monitor inventories are overdone. They note that as recently as last week, OIIM management reiterated that the monitor problems from Q4 have not resurfaced.
NVDA - Digitimes reports Nvidia on March 30 announced a new line of Nvidia Quadro FX graphics solutions, the Quadro FX 350M, 1500M, and 2500M, for mobile workstations, which will be incorporated into Dell's Precison M65 and M90 workstations. Nvidia Quadro FX mobile solutions offer the same features found in Nvidia workstation graphics solutions for desktop-based professional workstations, stated the company. These include exclusive features like 12-bit sub-pixel precision and full 32-bit floating point precision, noted Nvidia.
AKAM - Prudential expects another strong quarter out of Akamai driven by high levels of media traffic, particularly video. Firm raises their 1QE revenue and EPS ex-option expense to $87.1 mln and $0.17 (consensus is for $85.3 mln and $0.16) and their 2006E revenues and EPS ests to $371 mln and $0.73 (consensus is for $363.9 mln and $0.71). Given higher demand they are slightly increasing their capex forecast to 14% of revenue, putting some downward pressure on free cash flow. Despite continued strong business trends, they believe the stock has gotten ahead of itself.
Thursday, March 30, 2006
Watch List - Long
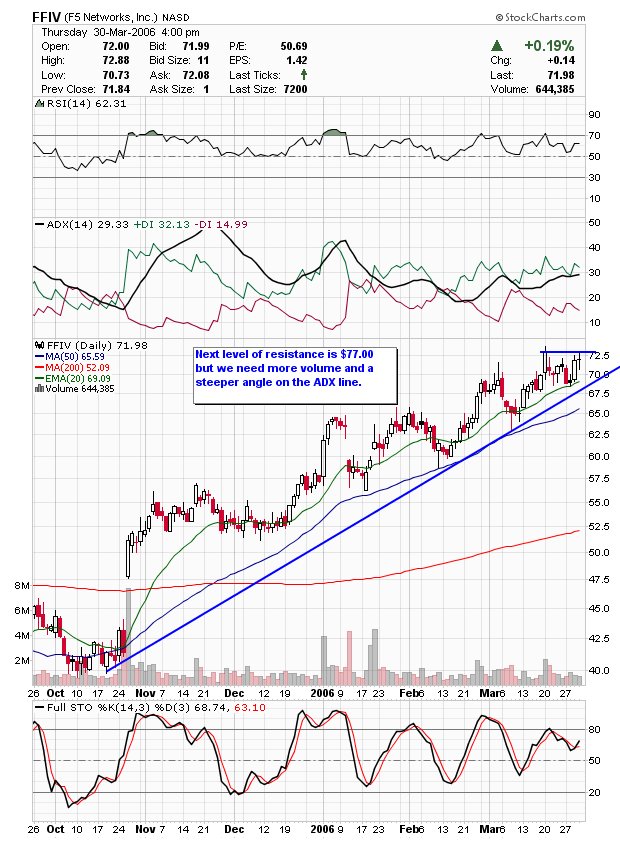 FFIV could go to $77.00 in the near term with a little more volume.
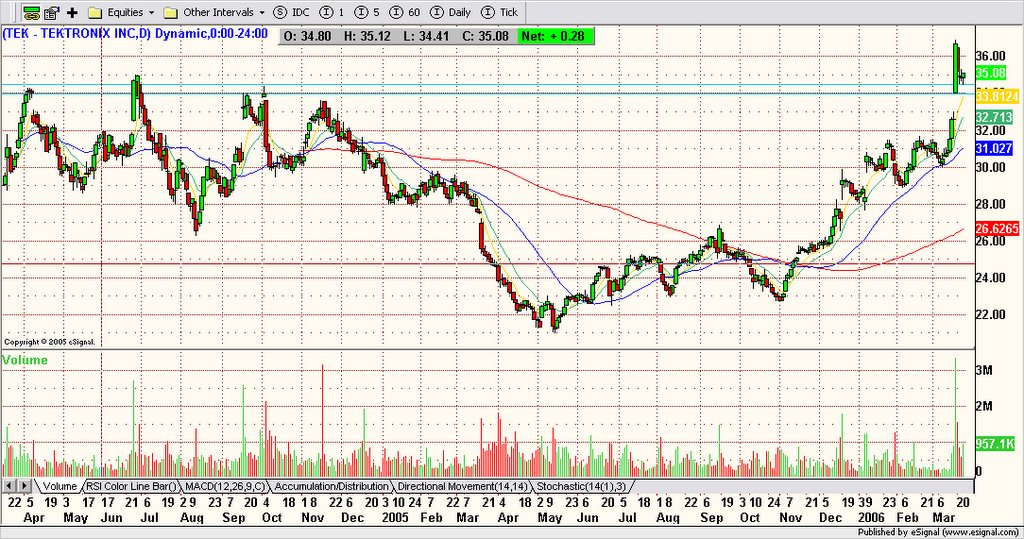
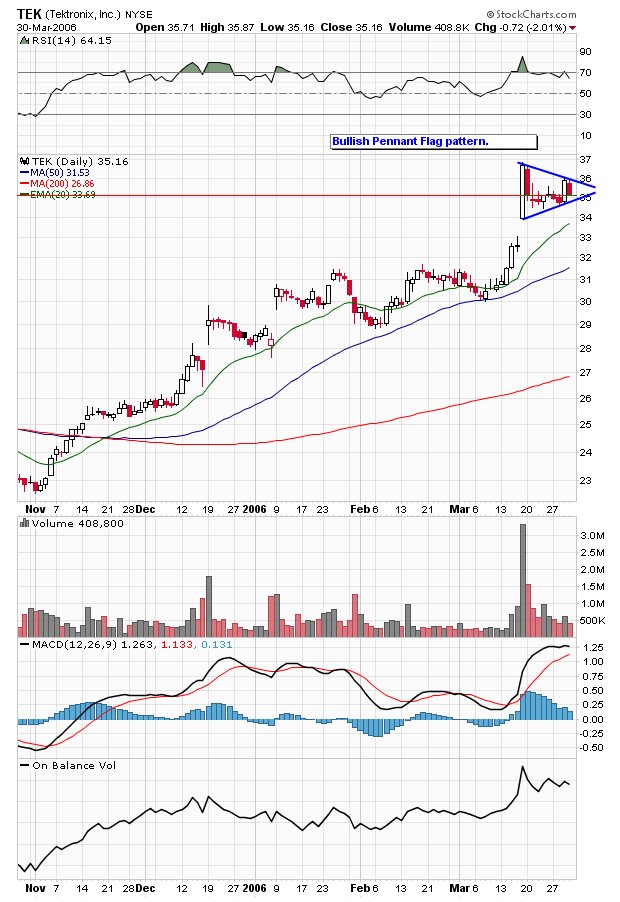 I'm still holding out for a bullish break on TEK. Today's close held support.
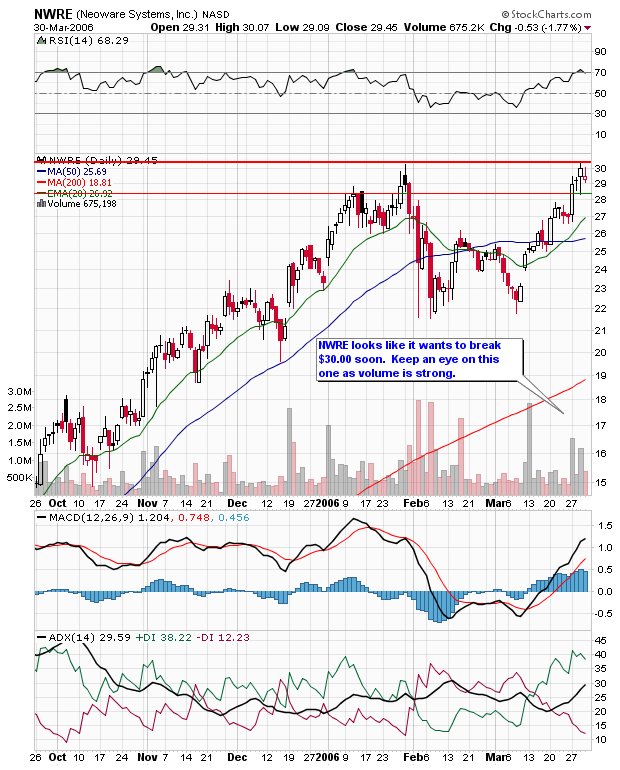 NWRE has strong momentum and should be able to breakout of $30.00 in the near term so keep this one on your radar.
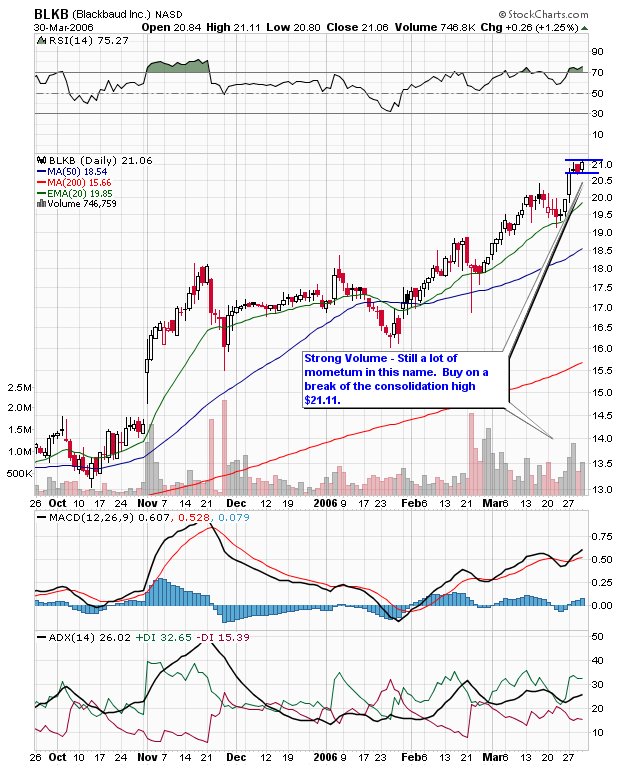 BLKB is a momentum play with strong volume. Buy on a break of the consolidation high above $21.11. No resistance.
Also keep an eye on AKAM, NVDA, ENER, OVTI and CREE which are consolidating recent gains. I'm still bullish on BRCM as well.
Nasdaq Technical Picture
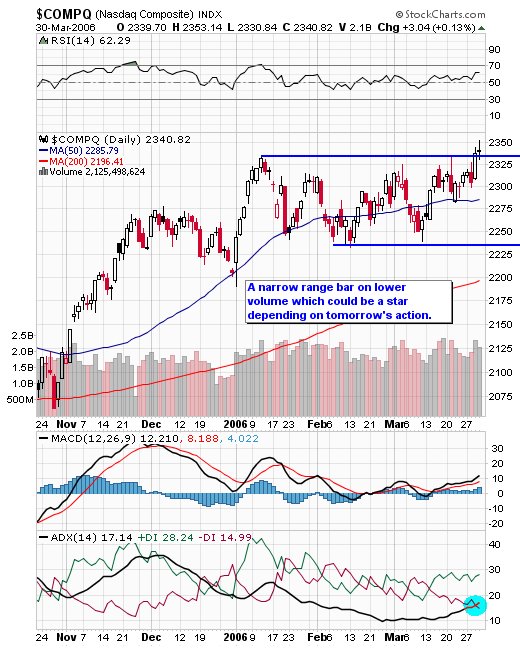 Not surprisingly, the market didn't give us much follow through after yesterday's quarter-end window dressing. The Nasdaq added just three points on lower volume and carved out what could be a star with shadows at both ends. The SOX and internets were weak, while hardware added to yesterday's gains. The advance just stalled at 10:00, came back in and the rest of the day was narrow range. The INDU meanwhile, carved out a bearish engulfing bar, but managed to close above support.
Trade of the Day
No trade of the day posting tonight as I was busy with another project most of day. This new project will be taking most of my time over the next week or two so I will be concentrating on early morning trade setups for the next little while. Regular postings in the evenings will continue on slightly delayed schedule.
Pre-Market
BBY trading up in pre-market on guidance; earnings in line.
BIDU starting to come back in after trading as high as $58.00 in AH trade yesterday. Last trade $57.34
QQQQ - Resistance at $42.00. Starting to weaken.
Top Trade counts: VPHM, ATYT, NOK
BIDU starting to come back in after trading as high as $58.00 in AH trade yesterday. Last trade $57.34
QQQQ - Resistance at $42.00. Starting to weaken.
Top Trade counts: VPHM, ATYT, NOK
Wednesday, March 29, 2006
Mailbag
I have fallen behind in answering my email, but I will catch up in the next few days. Sorry for the delay.
Watch List - Long
 CTXS - Potential consolidation breakout above $36.00 but caution that volume was weak today.
 ENER - Chart update.
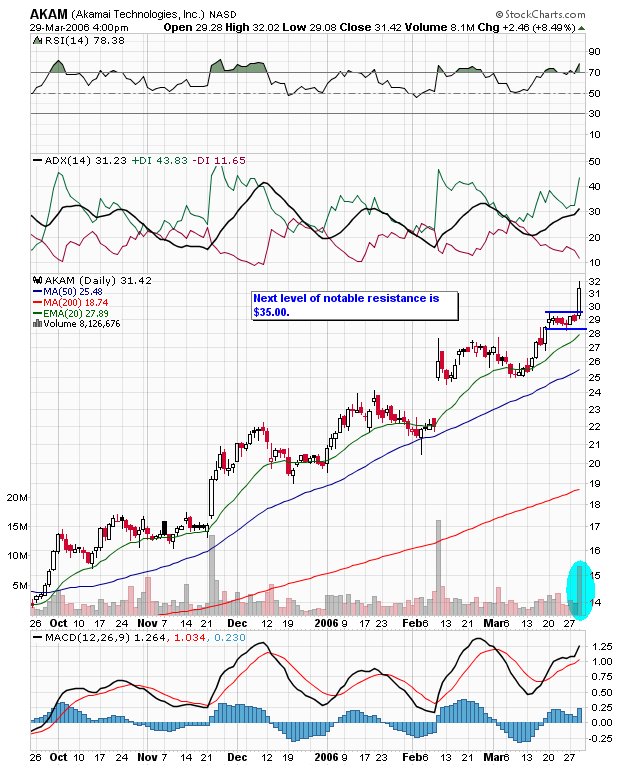 AKAM - Chart update. Next notable resistance level is $35.00.
 NVDA - I love you, but let me catch my breath.
 BRCM is oversold and looking to move higher from here. Today's action carved out a bullish engulfing reversal pattern with a long lower shadow on high volume. There's a lot of resistance overhead so a strategic entry point is key here.
 BIDU looks like it wants to move higher from here. There will be some resistance in the $55.75-$56.00 area, but on a break of $56.00, it could make a play for $60.00. The indicators and oscillators are bullish but we need more volume.
P.S. - BIDU traded up to $58.00 in AH on very little volume. I can't find any news and the message boards are rife with rumours.
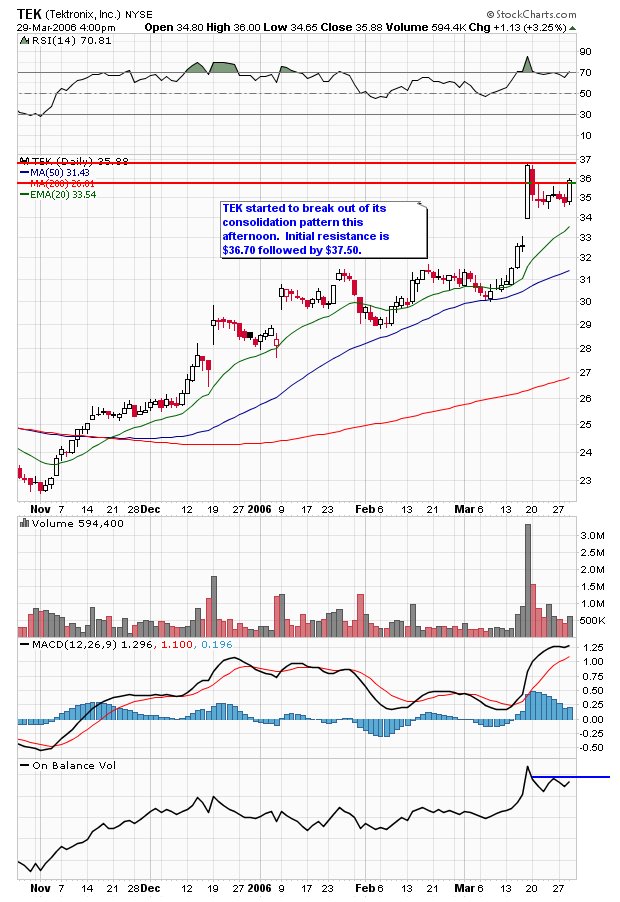 TEK started to break out of its narrow consolidation pattern this afternoon. I will try to pick this one up tomorrow on a pullback to intraday support ($35.30 - 35.70) or on a break of today's high, which ever comes first. The first level of resistance is $36.70, followed by $37.50 and eventually $40.00.
Nasdaq Technical Picture
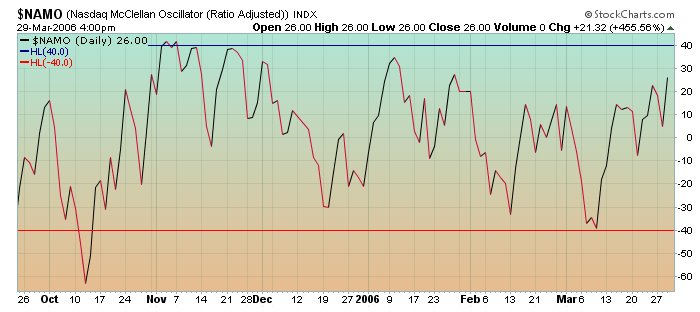
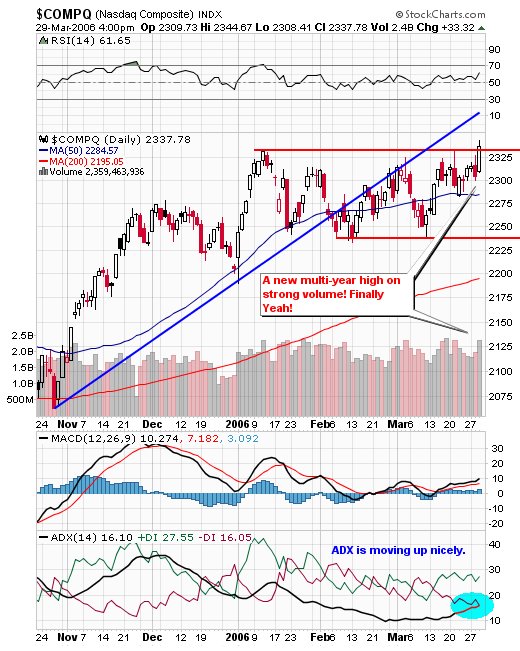 The Nasdaq had a great day as new institutional money went to work in a big way. This was a heavy accumulation day with lots of money going into semis, internets and hardware. The Nasdaq added 33 points, carving out a wide range bar which managed to close at a multi-year high. The big NDX winners were AAPL, XLNX, and NVDA. The ADX line looks like it may cross above the -D line at any moment. A push above 20 will really add some momentum going forward. From the McClellan Oscillator, we can see that we have yet to reach an extreme overbought level.
Trade of the Day - AKAM
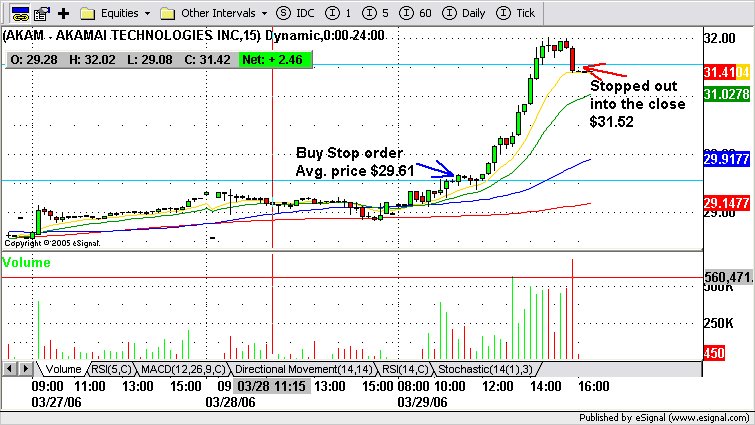 Profiled here on Monday night, AKAM was a classic consolidation breakout. My entry was triggered automatically on a buy stop order as it broke above the six day consolidation high. In mid afternoon I set a stop at the consolidation low and was stopped out into the close.
I've been waiting all month for this day and unfortunately I was away from my desk fo most of the day. However, I can't complain because I was able to get two very profitable trades. The balance of the ENER trade was closed at the end of the trading day.
In Play
Long ENER on a break of yesterday's high.
Update 10:06 EST - 50% profit locked in after $1.50 gain - Sweet! ENER was profiled here last night as a potential mover. I have personal business to attend. Back later this evening.
Update 10:06 EST - 50% profit locked in after $1.50 gain - Sweet! ENER was profiled here last night as a potential mover. I have personal business to attend. Back later this evening.
Pre-Market
Gapping Down: RHAT, PAYX
Interesting Observation: Institutions dress their quarter end books by adding more of the top performers even if they grossly overpay for them in the last week of the quarter.
UBS raises FDRY target from $17 to $21.
Stanford upgrades JCOM from Hold to BUY
UBS downgrades CAT and IR from Buy to Neutral
UBS believes recent weakness surrounding Fed actions and ongoing indications of a good but not great general system IC environment have created attractive opportunities in BRCM, MU and PMCS around earnings reports. In the firm's opinion, these companies and NETL are executing to solid business plans that will allow them to outperform throughout this period of uncertainty. Discussions in the PC channel and ongoing pricing pressure in the NAND industry leave MRVL and SNDK relatively (and respectively) more exposed to earnings disappointments than other names in their coverage.
Tuesday, March 28, 2006
Watch List - XLNX, PAYX, YHOO, ENER, CREE
 XLNX is just one of many bearish looking semi charts. I'm not in a rush to short first thing tomorrow, however, if the market tells me to short, I will be ready.
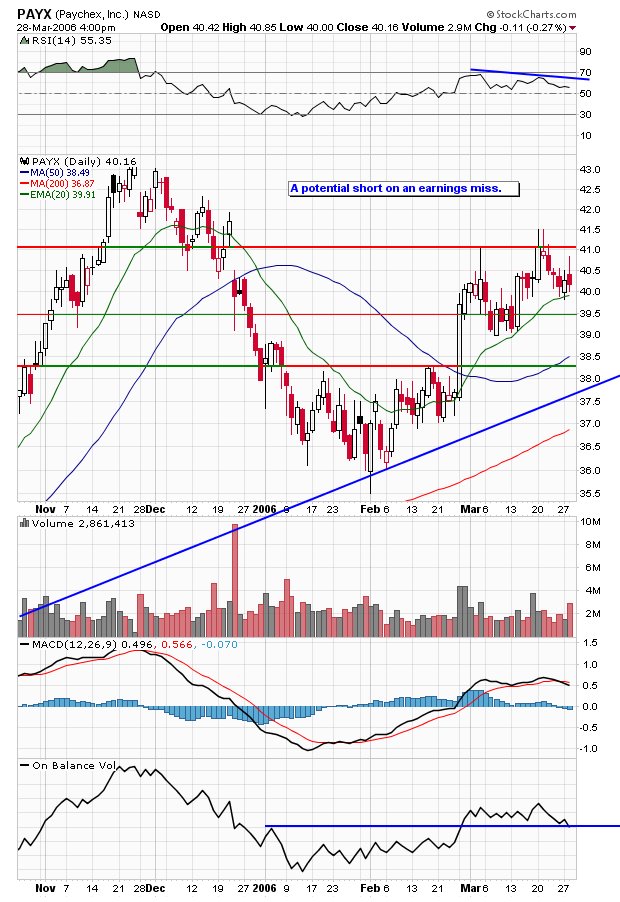 PAYX is a potential short on tonight's earnings miss.
 YHOO has finally broken the downward channel on a closing basis. The 50 MA may push it slightly lower and $32.00 may be a good entry point either for a swing or intraday trade.
 ENER could get interesting soon. Notice how volume has recently started to pick up on bullish days. A break of $50.00 on a closing basis will surely mean a retest of recent highs. It is currently in a very narrow trading consolidation and could break either way.
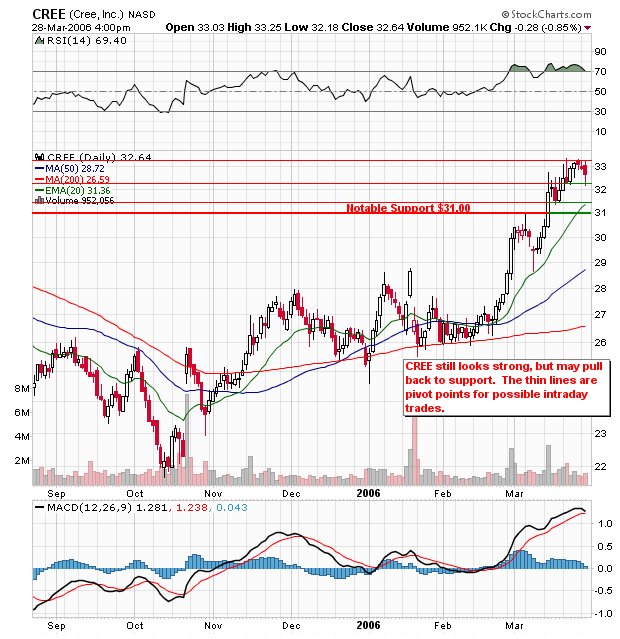 CREE is stiil strong here and can be traded intrday at key pivot points which are represented by the thin lines in the chart above.
NVDA may try to retest $55.00, but it looks like it's due for a pullback after a nice run.
Nasdaq Technical Picture
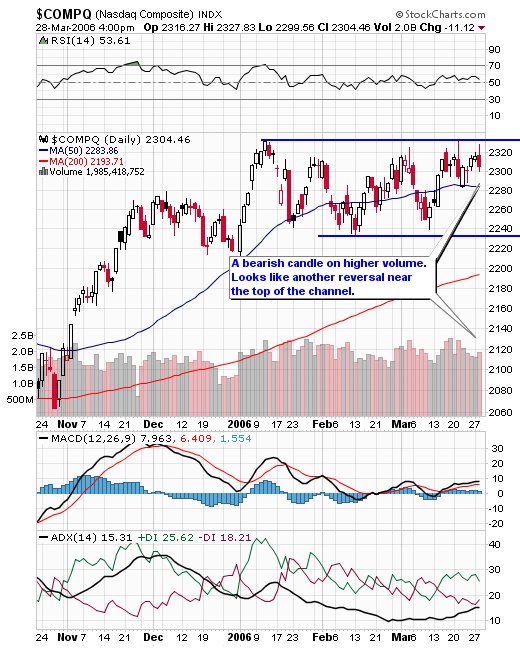 The first half of the day had more spark than I had anticipated, conversely, the response to the FED policy was more negative. It may have something to do with the 10 year yield combined with the lack of any indication as to when the rate hikes will come to an end, whatever it is, the markets don't like it and will likely correct in the near term. A close below the 50 day MA will be very bearish. The SOX led the way down and the internets were amazingly resilient in the last hours of trade.
Trade of the Day - QQQQ
 After the FED policy announcement, the QQQQ's fell precipitously, however, after the first wide range 5 minute bar lower, they came back up to test the $41.50 area, this was a low risk entry point with a stop just above the $41.50 pivot point. The fall was decisive with very little back and forth like we usually get. Since the market likes round numbers, I covered 50% at $41.02. I covered the balance when it was clear that $41.00 was going to hold as support. Note the capitulation type volume level as the Qs hit $41.00 for the first time, an hour after the policy release. (N.B. - Although this is not necessarily my best trade in terms of real $$, it is a good shorting example.)
Technical - QQQQs
The QQQQs have just broken resistance at $41.50 intraday after testing and failing on Friday and again yesterday.
My Favourite Technical Expert
The market is in the doldrums and will continue this way until the 2:15 Fed policy announcement, so now is a good time to catch up on some reading. Here is Mike Ashbaugh's take on the state of the markets along with a few trade ideas. Click here.
In Play - OVTI, NVDA, CREE
Long NVDA - Break of yesterday's high - 50% profit locked in.
Long CREE - On a pullback - entry $32.55
Update 11:30 EST - Sold Balance of NVDA. Bought a small position in OVTI.
Update 11:50 - CREE profit locked in - stopped out on a breach of 10 period EMA on 5 minute view.
Long CREE - On a pullback - entry $32.55
Update 11:30 EST - Sold Balance of NVDA. Bought a small position in OVTI.
Update 11:50 - CREE profit locked in - stopped out on a breach of 10 period EMA on 5 minute view.
Monday, March 27, 2006
Watch List - FDRY, QLGC, CREE, AKAM, NVDA, NEW, OVTI
 FDRY is making its way towards the next level of resistance - $18.55.
 QLGC violated its support neckline on a closing basis.
 CREE is pulling back to its pivot point $32.50.
 AKAM has been consolidating for a few days and is well positioned to continue its uptrend in the short-term.
 NVDA not showing any signs of slowing down just yet. Next level of resistance is in the area of $55.00.
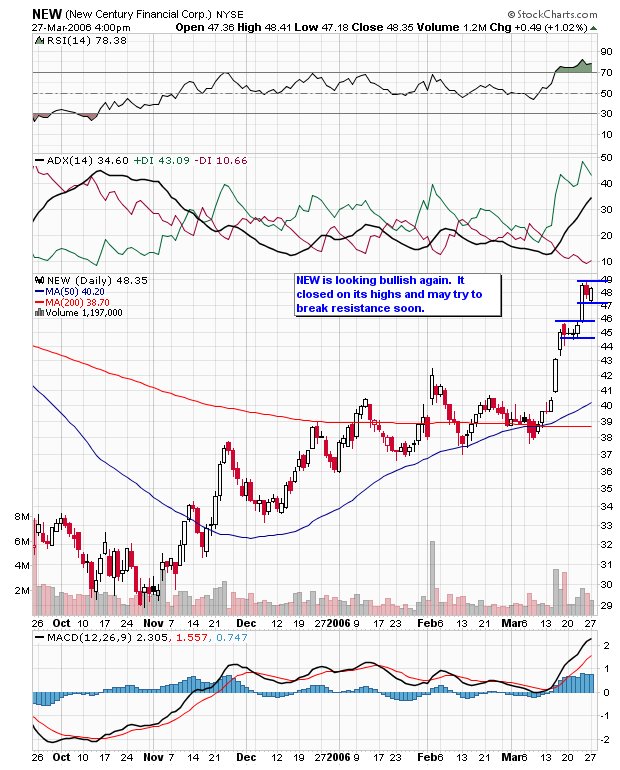 After gapping slightly lower this morning, NEW came back strong and closed on its highs. It is approaching resistance and may try to break tomorrow.
 OVTI meets all of the criteria for a three day consolidation breakout pattern. It also closed on its highs so watch this one on the open tomorrow. Ressistance in the $31.50 -31.90 area.
Nasdaq Technical Picture

The Nasdaq carved out a narrow range bar on relatively low volume ahead of the Fed policy annoucement tomorrow afternoon. Most tech sectors were modestly red, however, the gold and silver index did quite well today. Tech outperformed the other major indices. I will not be initiating any new positions after 12:00 tomorrow as things usually get fairly quiet in the few hours preceding the Fed announcement. Notice how the ADX line is finally starting to edge higher. This could be bullish if the ADX (black line) crosses above the -D (red line) as this will give us some momentum if we retest the highs. Today's NDX winners were ISRG, CHRW, GRMN and NVDA.
Trade of the Day - NVDA, MDG
I only executed two trades today and since they are different setups, I am posting both charts.
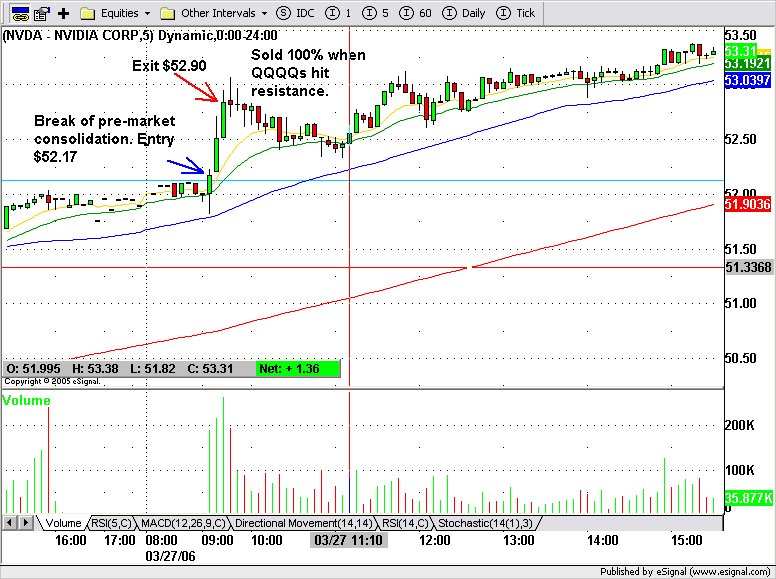
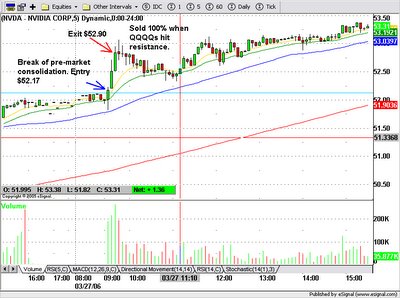 My alert for NVDA was triggered in the pre-market as it took out Friday's high. I watched it trade in a narrow consolidation prior to the open. I set a buy stop order 5 cents above the consolidation high and was filled at $52.17. I sold my entire position as soon as I noticed that the QQQQs had hit resistance at $41.50. I had it in mind that today's action would be narrow range given the FOMC meeting, so I was happy to grab this much profit right off the open.
 MDG gapped up this morning and had an orderly, shallow pullback to the rising 10 period EMA. The entry was made after the stock had demonstrated a few higher lows (15 Min. view) in the support area of its 10 EMA. The stop was just under the low of the previous bar. 50% profit was taken when price stalled in the $29.20-.25 area. The balance was sold on weakness shortly after a failed retest of the high.
 My alert for NVDA was triggered in the pre-market as it took out Friday's high. I watched it trade in a narrow consolidation prior to the open. I set a buy stop order 5 cents above the consolidation high and was filled at $52.17. I sold my entire position as soon as I noticed that the QQQQs had hit resistance at $41.50. I had it in mind that today's action would be narrow range given the FOMC meeting, so I was happy to grab this much profit right off the open.
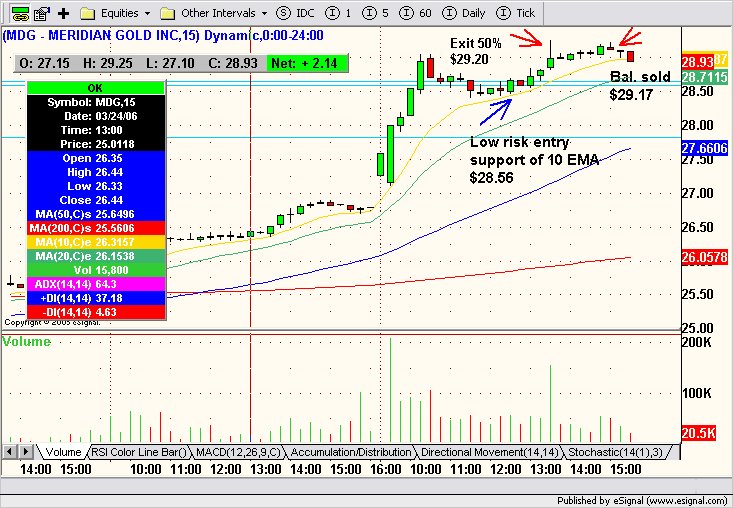 MDG gapped up this morning and had an orderly, shallow pullback to the rising 10 period EMA. The entry was made after the stock had demonstrated a few higher lows (15 Min. view) in the support area of its 10 EMA. The stop was just under the low of the previous bar. 50% profit was taken when price stalled in the $29.20-.25 area. The balance was sold on weakness shortly after a failed retest of the high.
In Play
Long NVDA - Position liquidated as soon as QQQQs hit $41.50 resistance. Entry $52.17 exit $52.90
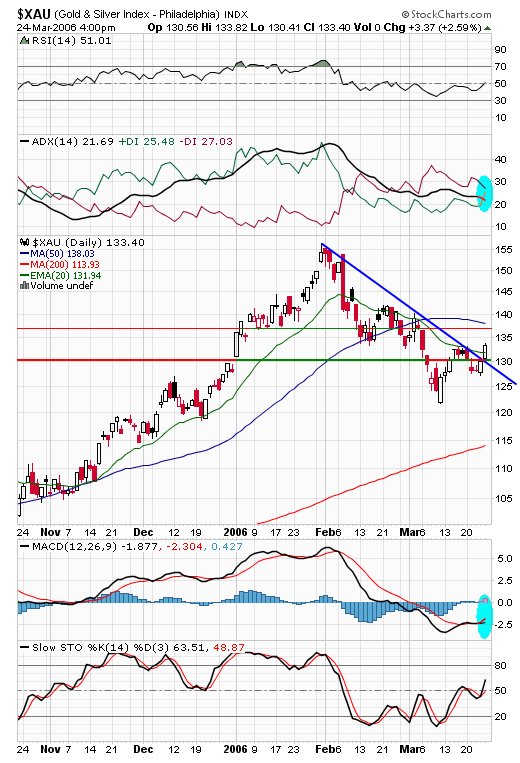
Several Gold and Silver names in the Gap Up scan.
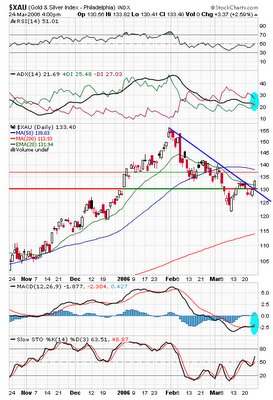
Update 2:10 EST - the $XAU has run into the resistance of its 50 day MA on the daily chart so gold positions may not be able to move much higher today. Took a position in MDG - low risk entry $28.56 - sold 50% at $29.20. Hoping for a retest of the high on the balance of the position. Currently consolidating at $28.96. However, I won't initiate any new gold positions today.
Update 3:14 - Sold balance of MDG position for $29.17
Several Gold and Silver names in the Gap Up scan.
Update 2:10 EST - the $XAU has run into the resistance of its 50 day MA on the daily chart so gold positions may not be able to move much higher today. Took a position in MDG - low risk entry $28.56 - sold 50% at $29.20. Hoping for a retest of the high on the balance of the position. Currently consolidating at $28.96. However, I won't initiate any new gold positions today.
Update 3:14 - Sold balance of MDG position for $29.17
Pre-Market
N and AL upgraded from Hold to Buy at Citigroup
QQQQ pulling back towards support
AMGN - just out - Amgen announces FDA Approves Extended Dosing of Aranesp to Treat Chemotherapy-Induced Anemia
NIHD - Gapping up above $56.00 (all time high)- can't find any news
QQQQ pulling back towards support
AMGN - just out - Amgen announces FDA Approves Extended Dosing of Aranesp to Treat Chemotherapy-Induced Anemia
NIHD - Gapping up above $56.00 (all time high)- can't find any news
Sunday, March 26, 2006
Sector Watchlist
The market is likely to take a wait and see approach until Tuesday's 2:15 Fed policy announcement. In the meantime it might be a good strategy to buy intraday pullbacks of strong sector stocks. Here are a few of the best looking tech sectors going into next week.
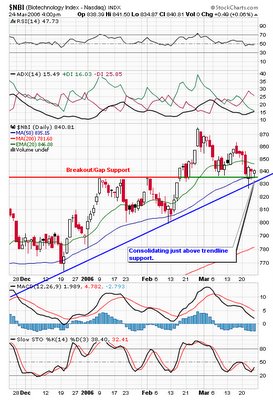
 NBI
NBI
 NWX
NWX
 SOX
SOX

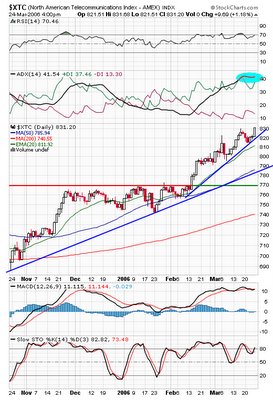
Gold and silver ($XAU) is another sector that looks strong going into next week.
XTC
 NBI
NBI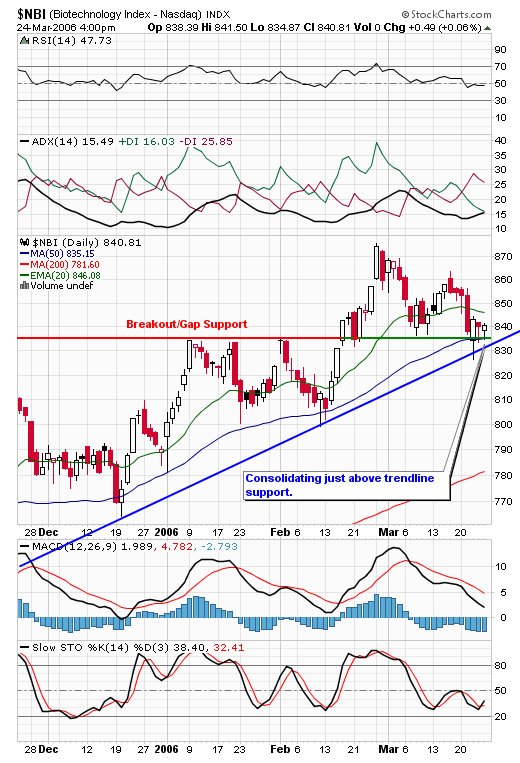 NWX
NWX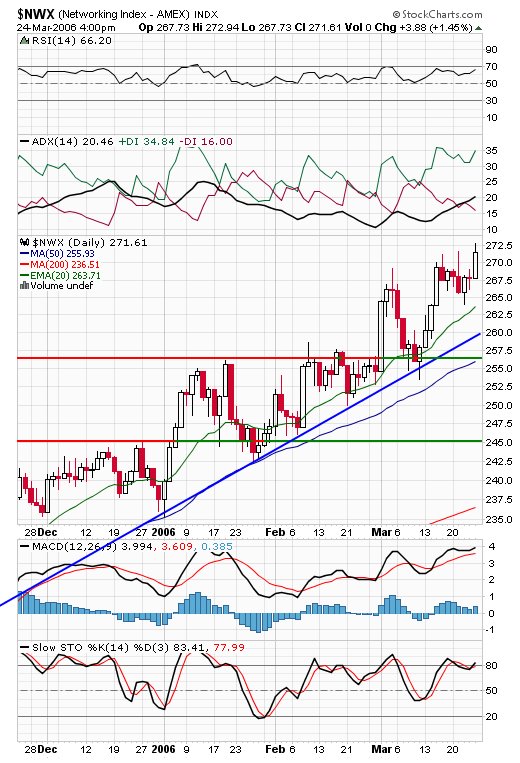 SOX
SOX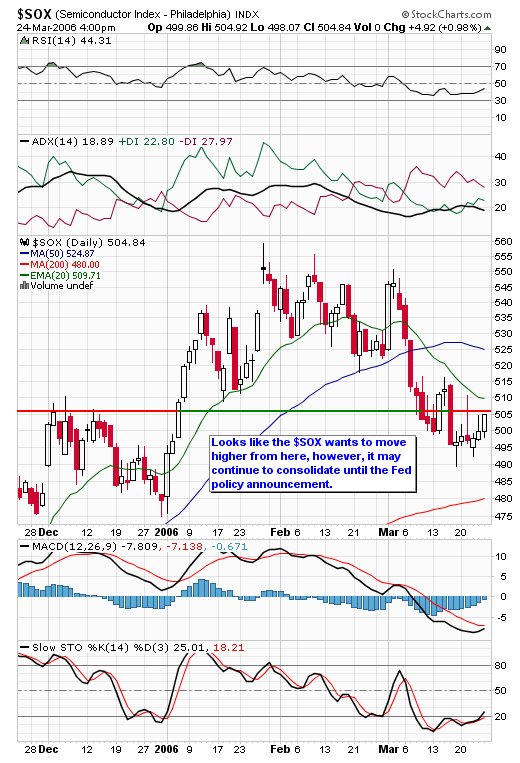
Gold and silver ($XAU) is another sector that looks strong going into next week.
My Trading Style - Overview
In response to reader mail, this post is a brief overview of key ingredients in my trading management.
Currently, my trading is focused primarily on stage 2 stocks. This is my bread and butter as I am a bull by nature. My repertoire of stocks is mainly focused on Nasdaq stocks, however, recently I’ve had success with a couple of NYSE stocks. I prefer Nasdaq level II screens for intraday trading because it allows me to place my bid at the same level as the proprietary traders of the Wall Street firms. My preference is for highly liquid stocks in the $20 - $100 range that trade in an orderly fashion. I avoid charts with too many gaps and/or masses of overlapping candles. Anyone, who’s been reading this blog regularly over a period of time, is aware by now that my favorite sector is semiconductors.
Nightly Preparation:
Using Stockcharts.com, I have created a folder for each major tech sector where I save updated charts of all stocks that meet my criteria outlined above. I review all of these charts nightly to look for developing patterns, trends, consolidations, etc. I take note of the charts which have potential to move in the following trading session and I outline which entry price would be the best entry point ie. a breakout price and a pullback to support price (breakouts on high volume are my favorite setup). I set alerts for these trade setups in eSignal. I also review Trade-Ideas.com late day scans for any potential breakouts/breakdowns and add alerts for these as well. Finally, I run a few of my own pre-defined scans and add alerts as required. I then plot key support/resistance lines, pivot points and trendlines on my eSiganl charts for the stocks I plan to trade the following day.
I also check Briefing.com for stocks trading up or down in AH (after hours). AH movers are especially important when they are bellwether as they have the potential to move the entire market or sector.
Before the market opens I review Briefing.com for important news that will move the market or individual names. Upgrades/downgrades, especially by notable firms, are important. I also check the trade counts/rates for stock moving in the pre-market to see if there are any interesting gap-up plays. Gap-ups and gap downs are usually good during the early phase of earnings season and/or a strong stage two market rally, however, they have not been a big part of my trading strategy since we’ve been in this narrow Nasdaq trading channel. Finally, I look at the NDX and S&P futures and the QQQQ intraday support and resistance to see how the market will open and try to get some hints as to direction.
Trading Tools:
Here is a list of the trading tools and software I use:
Key Ingredients to my chart anaylsis:
Price, volume, candlestick patterns, support and resistance, moving averages, ADX (momentum), and trendlines. I evaluate all of these ingredients on the daily timeframe. On the intraday timesframe, I do not always look at the ADX. My most used timeframes for intraday trading are the 5 and 15 minute views. I always validate a trade setup on 2-3 different time frames before pulling the trigger.
Three Day Consolidation Breakout - My Criteria
I will elaborate more on individual trade setups in future posts. Here is an example of my criteria for a three day consolidation pattern breakout which I used successfully several times this past week, most notably with OVTI and NEW.
I look for stocks that are:
1. In an uptrend ( at least one higher low and one higher high) but preferably a stage two uptrend as these setups have a higher degree of success;
2. At least three days of consolidation in a narrow trading range preferably at the uppermost level of the recent trading range;
3. lower volume during the consolidation period;
4. An attempt to break out the day prior to the actual breakout - this usually is a retest of the highs of the consolidation range;
5. And finally, I prefer when the stock closes at or near its highs of the consolidation range on the eve of the the actual breakout. However, this last point is not always met and does not preclude me from taking the trade.
When the breakout occurs, it is accompanied by high volume.
Currently, my trading is focused primarily on stage 2 stocks. This is my bread and butter as I am a bull by nature. My repertoire of stocks is mainly focused on Nasdaq stocks, however, recently I’ve had success with a couple of NYSE stocks. I prefer Nasdaq level II screens for intraday trading because it allows me to place my bid at the same level as the proprietary traders of the Wall Street firms. My preference is for highly liquid stocks in the $20 - $100 range that trade in an orderly fashion. I avoid charts with too many gaps and/or masses of overlapping candles. Anyone, who’s been reading this blog regularly over a period of time, is aware by now that my favorite sector is semiconductors.
Nightly Preparation:
Using Stockcharts.com, I have created a folder for each major tech sector where I save updated charts of all stocks that meet my criteria outlined above. I review all of these charts nightly to look for developing patterns, trends, consolidations, etc. I take note of the charts which have potential to move in the following trading session and I outline which entry price would be the best entry point ie. a breakout price and a pullback to support price (breakouts on high volume are my favorite setup). I set alerts for these trade setups in eSignal. I also review Trade-Ideas.com late day scans for any potential breakouts/breakdowns and add alerts for these as well. Finally, I run a few of my own pre-defined scans and add alerts as required. I then plot key support/resistance lines, pivot points and trendlines on my eSiganl charts for the stocks I plan to trade the following day.
I also check Briefing.com for stocks trading up or down in AH (after hours). AH movers are especially important when they are bellwether as they have the potential to move the entire market or sector.
Before the market opens I review Briefing.com for important news that will move the market or individual names. Upgrades/downgrades, especially by notable firms, are important. I also check the trade counts/rates for stock moving in the pre-market to see if there are any interesting gap-up plays. Gap-ups and gap downs are usually good during the early phase of earnings season and/or a strong stage two market rally, however, they have not been a big part of my trading strategy since we’ve been in this narrow Nasdaq trading channel. Finally, I look at the NDX and S&P futures and the QQQQ intraday support and resistance to see how the market will open and try to get some hints as to direction.
Trading Tools:
Here is a list of the trading tools and software I use:
- eSignal – This is used as my main trading platform to track charts, level II, time and sales, etc.
- Interactive Brokers – Execution – (commissions are cheap – half a penny per share with a 1 dollar minimum per trade)
- Trade-Ideas.com – Best scanning tool on the market because of the built in filters. (refer to link on my right side panel)
- Daytrade Team.com – Excellent educational and stock picking service for day and swing traders, a must for beginners. (refer to link in my upper right hand side panel)
- Stockcharts.com – Real time Extra. – for intraday scanning and creating folders of potential intraday trade setups.
- Briefing.com – market moving news
Key Ingredients to my chart anaylsis:
Price, volume, candlestick patterns, support and resistance, moving averages, ADX (momentum), and trendlines. I evaluate all of these ingredients on the daily timeframe. On the intraday timesframe, I do not always look at the ADX. My most used timeframes for intraday trading are the 5 and 15 minute views. I always validate a trade setup on 2-3 different time frames before pulling the trigger.
Three Day Consolidation Breakout - My Criteria
I will elaborate more on individual trade setups in future posts. Here is an example of my criteria for a three day consolidation pattern breakout which I used successfully several times this past week, most notably with OVTI and NEW.
I look for stocks that are:
1. In an uptrend ( at least one higher low and one higher high) but preferably a stage two uptrend as these setups have a higher degree of success;
2. At least three days of consolidation in a narrow trading range preferably at the uppermost level of the recent trading range;
3. lower volume during the consolidation period;
4. An attempt to break out the day prior to the actual breakout - this usually is a retest of the highs of the consolidation range;
5. And finally, I prefer when the stock closes at or near its highs of the consolidation range on the eve of the the actual breakout. However, this last point is not always met and does not preclude me from taking the trade.
When the breakout occurs, it is accompanied by high volume.
Friday, March 24, 2006
Nasdaq Technical Picture
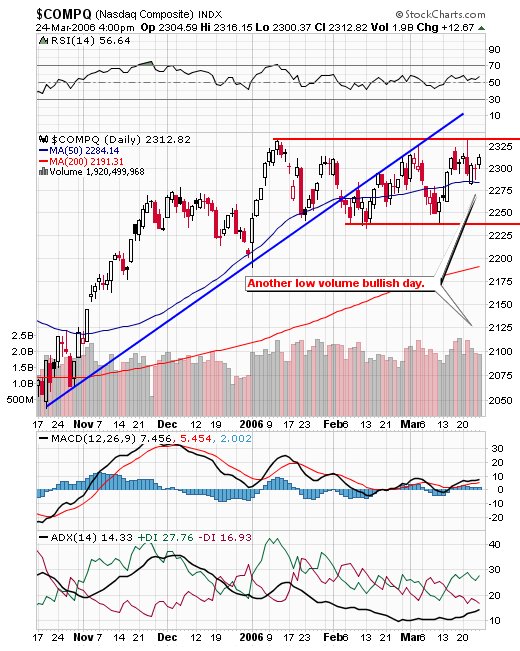 There wasn't enough volume for any sort of follow through in today's session and I noticed a lot of failed breakouts. But despite all of that, the Nasdaq added 12.7 points and looks well positioned to retest its highs next week. Networking and semi stocks were today's leaders. Today's big NDX winners were TLAB, GOOG, and AMLN. In the semi space SNDK and NVDA were the best performers and BRCM the weakest with a violation of the 50 MA on a closing basis.
Trade of the Day - NVDA
 NVDA on a break of yesterday's high. 50% of profit locked in on the first signs of a reversal and the balance was stopped out.
In Play
Longs - ELOS, TEK, NVDA
Update 10:50 EST - ELOS abandoned 50 % of position as it stalled, NVDA 50% profit locked in. TEK - Tightened stop to $35.25
Update 1:00 - stopped out on TEK (scratch), abandoned balance of ELOS and I've just locked in profits on the balance of the NVDA trade.
Update 10:50 EST - ELOS abandoned 50 % of position as it stalled, NVDA 50% profit locked in. TEK - Tightened stop to $35.25
Update 1:00 - stopped out on TEK (scratch), abandoned balance of ELOS and I've just locked in profits on the balance of the NVDA trade.
Thursday, March 23, 2006
Watch List
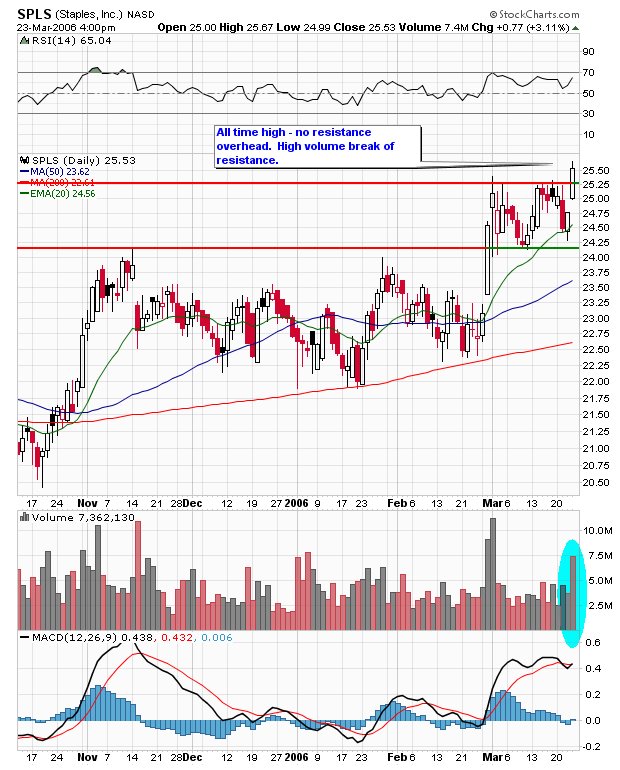
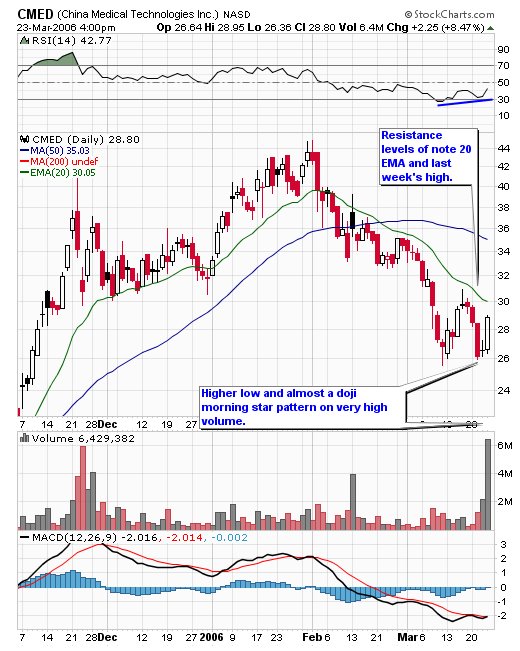
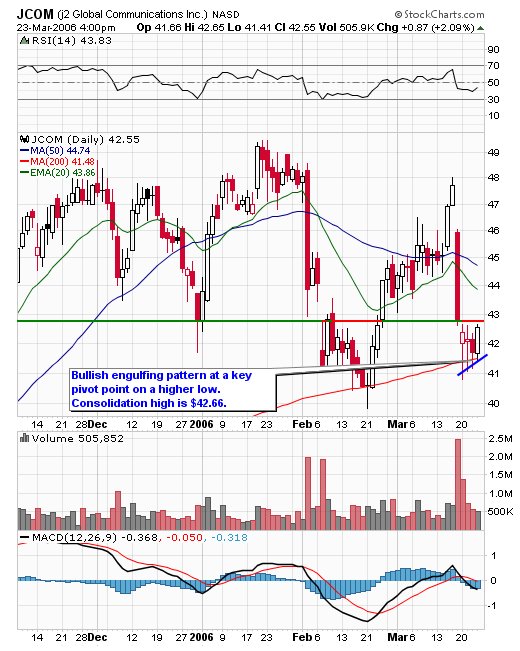 JCOM is high risk. This pattern is recommended for day trading purposes only. On a high volume break of the consolidation pivot point.
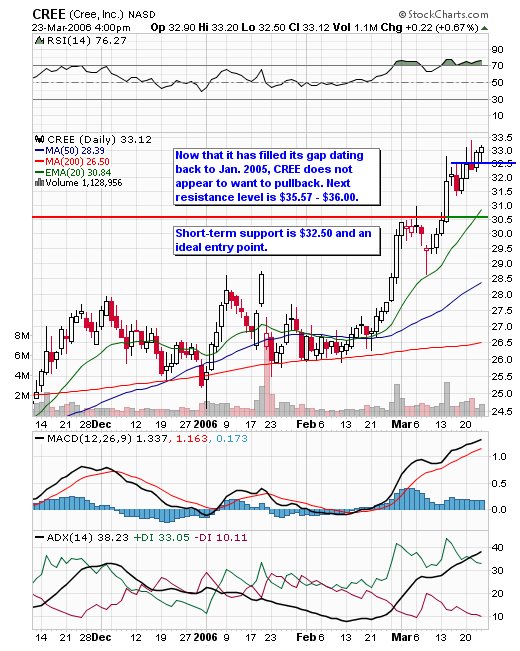
 Click on charts for larger views.
Nasdaq Technical Picture

Another choppy day on the Nasdaq with relatively little damage on lower volume. The Nasdaq carved out a narrow range inside bar with a small upper shadow and longer lower shadow. We retested yesterday's high but not yesterday's low so we end the day on a slightly positive note. Another positive is that the SOX was the strongest of the major tech sectors, lead by MRVL and NVDA which had a nice moves today.
Subscribe to:
Posts (Atom)