 I'm expecting more consolidation at least until we get the jobs data on Friday and maybe until next week's elections. In the meantime, biotechs and semis seem to be the best positioned sectors for longs. Internet stocks which have been the leading tech sector of late, may be due for a pullback after disappointing earnings from BIDU. Economic data tomorrow: Construction spending and the ISM index at 10:00 EST; followed by Crude inventories at 10:30. GRMN reports before the bell and BOOM after hours.
Tuesday, October 31, 2006
NASDAQ Technical Picture - Another Consolidation Day
I'm expecting more consolidation at least until we get the jobs data on Friday and maybe until next week's elections. In the meantime, biotechs and semis seem to be the best positioned sectors for longs. Internet stocks which have been the leading tech sector of late, may be due for a pullback after disappointing earnings from BIDU. Economic data tomorrow: Construction spending and the ISM index at 10:00 EST; followed by Crude inventories at 10:30. GRMN reports before the bell and BOOM after hours.Dummy Trade of the Day - NVIDIA Corporation (Public, NASDAQ:NVDA)
 NVDA is always front and centre on my trading screen, so I didn't have to run a gapper scan to catch this setup. The OR was wide and bullish. The next bar was NR with a long upper shadow followed by a bearish engulfing bar. The fourth bar came in deep but reversed forming a long lower shadow and signaling that the pullback was over. As soon as price took out the high of the reversal bar, I went long. I knew we had resistance coming in at $34.50, but volume was very bullish and I decided to hold on for a bigger gain. Price rallied into resistance and reversed, pulling back to the OR high, after which it took off again, closing on the 50% Fibonacci extension.
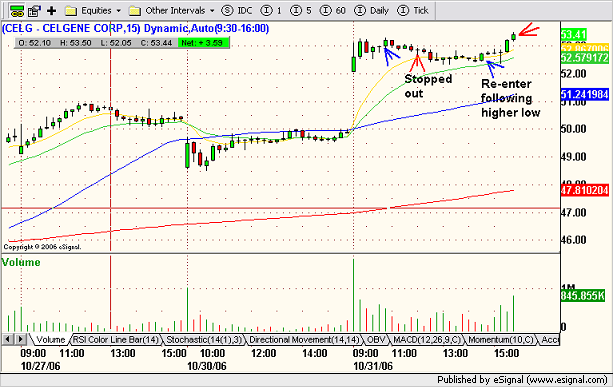 Celgene (NASDAQ: CELG) was from a gapper scan. My entry was a low risk dummy entry, after what I thought at the time, was a proper consolidation of the initial gap up. As soon as I entered at $53.00, the stock took off and I thought I had another winner. Unfortunately, after tagging $53.30, CELG pulled back and I eventually was stopped out. In retrospect, price was too far above the rising 10 period MA on my entry. Price and the short-term MA can never get away from each other for very long. I re-entered CELG in mid-afternoon after price carved out a higher low and crossed over the 10 period MA. This second trade covered twice the original loss.
Monday, October 30, 2006
NASDAQ Technical Picture - Mixed
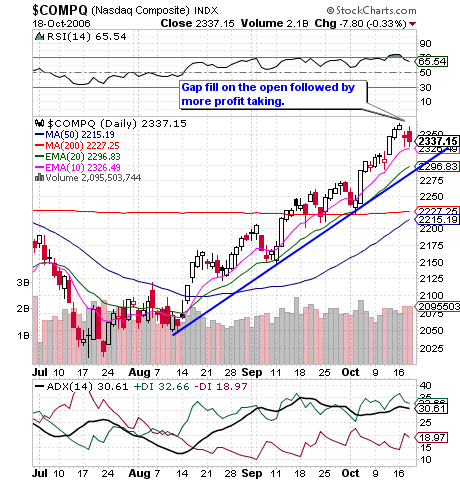
 The NASDAQ was able to limit downside pressure by reversing just above support at 2340, however, it carved out a lower low and lower high on relatively lower volume which could be an early sign that the bulls have lost some of their conviction. Expect more choppiness until we breach 2375 on the upside or the trendline on the downside. Tomorrow's economic calendar includes Chicago PMI and Consumer Confidence at 10:00 EST. On the earnings front we have US Steel (NYSE:X) and (NASDAQ:UARM) before the bell and (NASDAQ:BIDU) after hours.
Michelle B. - StockTickr Interview
If you haven't already done so, check out Dave's interview with Michelle B., Trader Mike's prolific and eloquent contributor. With 10 years trading experience, Michelle has lots of trading insights to offer new and less experienced traders.
I am thrilled that Wall St. Warrior is among Michelle's favorite sites. Merci Michelle!
I am thrilled that Wall St. Warrior is among Michelle's favorite sites. Merci Michelle!
Dummy Trade of the Day - Entercom Communications Corp. (Public, NYSE:ETM)
 ETM was picked up on my gapper scan and it had all of the key elements that I look for in a gapper setup: high volume relative to the previous four sessions; fairly narrow gap consolidation while the MA catches up to price; and continuation following a test of the OR high. That continuation bar was my entry. My exit was the first lower high following the evening star reversal top.
Technical Trade Ideas - (NYSE:TIE), (NYSE:X)
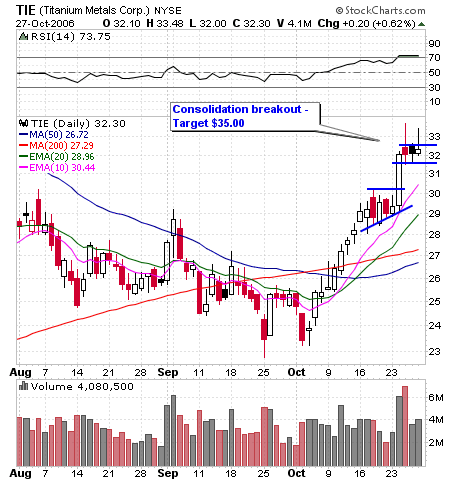
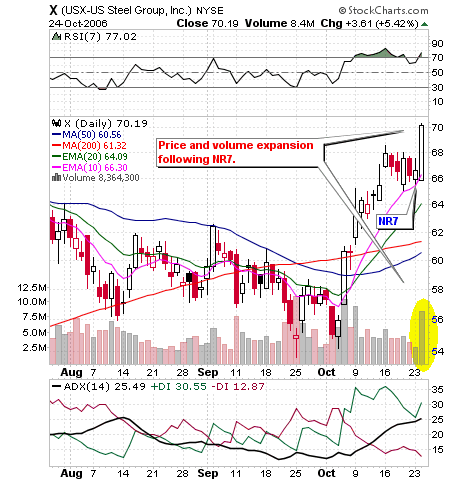
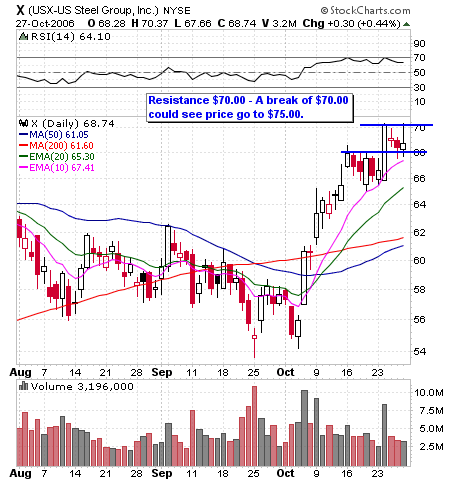 Both TIE and X are well positioned for a potential consolidation breakouts following three days of narrow rnage trading. Notice that both stocks carved out higher lows on Friday. Also notice that last Tuesday both stocks had a high volume price expansion following NR7 bars.
Pre-Market
RBC upgrades KLA-Tencor (KLAC 48.19) to Outperform from Sector Perform... Merrill upgrades Yahoo (YHOO 25.34) to Buy from Neutral with a $32 tgt. Baird lowers SanDisk (SNDK 48.04) tgt to $60 from $68, as they believe NAND flash pricing is already past a peak, with a potentially significant pricing decline in the first quarter as the co's NAND flash output could potentially exceed for the first time its NAND flash card distribution potential.
Courtesy of Briefing.com
Courtesy of Briefing.com
Sunday, October 29, 2006
NASDAQ Technical Picture - Failed Breakout?
Weekly Timeframe

Daily Timeframe
 Friday morning the market gapped down on weak GDP numbers. Shortly after filling that gap, the NASDAQ went into a free fall. According to Briefng.com, the selloff was triggered by a Goldman Sachs growth forecast revision for motherboard shipments which, it was noted were "falling off a cliff". The NASDAQ posted only a minor gain on the week compared to the S&P and INDU. Since the NASDAQ usually leads this may be an early sign that we may be in for a pullback and that would be healthy given the August - October run. The SOX closed on its 50 day MA, giving back 9 points between 1:00 and 3:00 on Friday afternoon.
Friday, October 27, 2006
Dummy Trade of the Day - Titanium Metals Corporation (Public, NYSE:TIE)
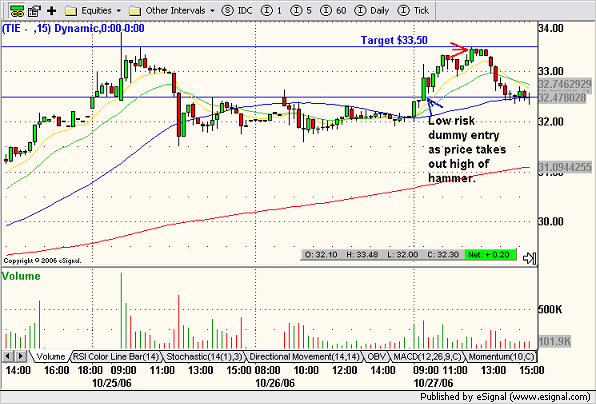
After consolidating Tuesday's big move for two sessions, TIE edged up towards short-term resistance early in the session. I entered before resistance was tested on a low risk, dummy setup following a small hammer. My target was $33.50 and I exited just pennies below as TIE came within two cents but couldn't manage to tag my price.
Trade of the Day - NASDAQ 100 Trust Shares (ETF) (Public, NASDAQ:QQQQ)
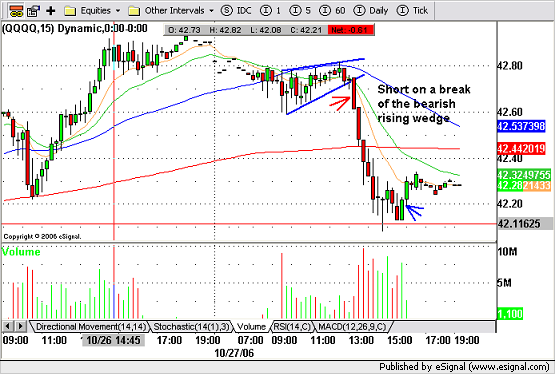
The QQQQs gapped lower on the open following weaker than expected GDP numbers. Shortly after, they started to consolidate and over a period of a few hours, managed to close the gap. The consolidation took the form of a bearish rising wedge. Shortly after 1:00 p.m. EST, the wedge broke and the Qs fell down. I shorted at $42.65 and covered at $42.20.
Between 1:00 and 2:00 ET, it was reported that Goldman Sachs was cutting their growth forecast for motherboard shipments. After the broker reportedly said motherboard demand is "falling off a cliff," tech stocks did just that. Courtesy of Briefing.com
Between 1:00 and 2:00 ET, it was reported that Goldman Sachs was cutting their growth forecast for motherboard shipments. After the broker reportedly said motherboard demand is "falling off a cliff," tech stocks did just that. Courtesy of Briefing.com
Thursday, October 26, 2006
NASDAQ Technical Picture - Another High Volume Breakout
 Some profit taking followed the NASDAQ's opening gap up, but by mid-morning the market reversed off of its lows and followed up with a steady climb into the close. Most major tech sectors participated except software (RHAT and SYMC). Biotechs were very strong on the heels of some good earnings including CELG, which closed at an all time high.
After hours, AKAM reported a healthy quarter, beating by 0.02 cents, but failed to dazzle. Guidance was just slightly above consensus. Same type of reaction to MSFT.
Tomorrow's economic calendar includes GDP at 8:30 EST, followed by Michigan Sentiment at 9:50.
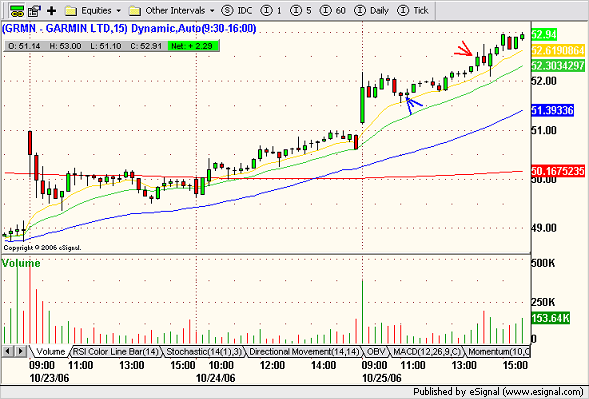
Dummy Trade of the Day - Garmin Ltd. (Public, NASDAQ:GRMN)
 I like to stick with my winners, so when GRMN gapped up and immediately reversed back down to retest yesterday's high, I was on the lookout for a low risk dummy entry. As soon as things settled down and price tagged the rising 10 period MA, I went long. It was a slow, but smooth ride as price stayed just comfortably above the MA throughout the session. I exited the trade into the close. Notice how price maintained a 45 degree angle for most of the session until after 3:00 when volume picked up.
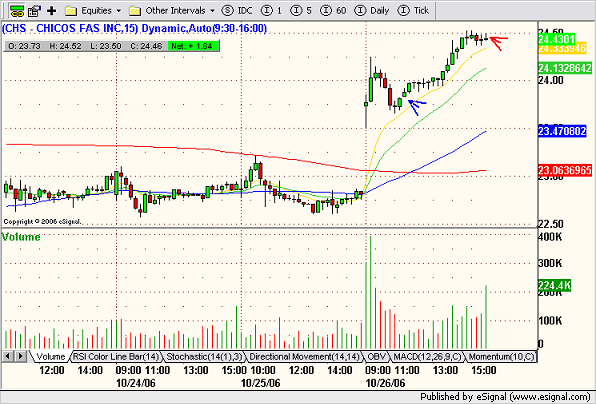 Another gapper, this time from a scan. I waited until CHS reversed off of the rising 10 period MA and took a dummy long entry. Exit into the close.
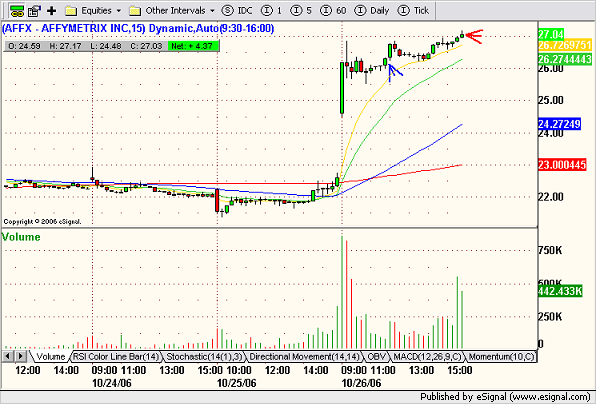 AFFX was another name I picked up from the gapper scan. I went long as price crossed $26.00 after a few very NR bars. Shortly after I entered , price pulled back to the rising 10 period MA. The price action was so slow, I thought that it was going to lose its momentum, but things picked by mid-afternoon.
Wednesday, October 25, 2006
NASDAQ Technical Picture - SOX Regains its 50 MA
 The SOX opened strong and rallied from 446 to 456 in the first hour of trade. Leading the way was KLAC following a strong earnings report last night. Also, pacing the way were BRCM, MXIM, and LRCX. The SOX closed near its highs once the FED statement was out of the way. Other strong tech sectors included disk drive and internet. From the chart above you will notice that the NASDAQ has held its 10 day EMA very well throughout this consolidation phase.
After hours FFIV beat handily and guided higher. On the docket tomorrow morning we have a few biotech names including CELG, MLNM, and MEDI. Tomorrow AH, one of my favorites - AKAM.
On the economic calendar we have Initial Claims and Durable Orders before the open, followed by New Home Sales at 10:00.

Dummy Trade of the Day - Garmin Ltd. (Public, NASDAQ:GRMN)
 GRMN was a gap up play from my 10:00 scan. The list this morning was longer than usual, so I took the time to go over the charts and narrow my selection. Although GRMN did not meet my volume criteria, I took the trade because of the candlestick setup and the proximity of my entry to the rising 10 period EMA. GRMN tagged the MA and reversed forming a small hammer. As soon as price took out the high of the hammer, I went long. I exited my position at 2:00 just prior to the release of the Fed policy statement.
Tuesday, October 24, 2006
NASDAQ Technical Picture - Consolidation Day Ahead of Fed
 The NASDAQ is showing signs of weakness as the SOX looks like it may rollover after all. AH KLAC and QLGC are trading up on earnings and CYMI is way down. The NAZ carved out a NR inside bar ahead of the FED policy statement tomorrow. Rumour has it that the statement will be on the hawkish side, so I will make sure to close all of my positions before 2:00 EST.
On a more positive note, AMZN is up 14% AH on a favorable earnings report. Earnings tomorrow include MNST before the open, and FFIV and MCHP after hours.
Welcome to New Visitors
Traffic has been up 50% in the last two days thanks to feed links from Trader Mike and The Kirk Report. I also noticed quite few searches for the new series "Wall Street Warriors" stopping by. I posted on that series here on Sunday so you can check it out by scrolling down below or by clicking here.
NR7 Price Expansion - United States Steel Corporation (Public, NYSE:X)
 Click on chart to enlarge
Here is a great example of Trader Mike's NR7 price expansion in action. Regular readers know that I have been trading Us Steel (NYSE:X) quite a bit since it showed up on a gapper scan on October 5th. Today, however, the internet where I work was down most of the morning, so I missed out on this huge move.
Trade of the Day - Akamai Technologies Inc. NASDAQ (AKAM)
 I took a low risk entry on AKAM after it successfully retested breakout support and I held on until the close. A successful retest of support is often an indication that the stock has digested the break and is ready to move higher.
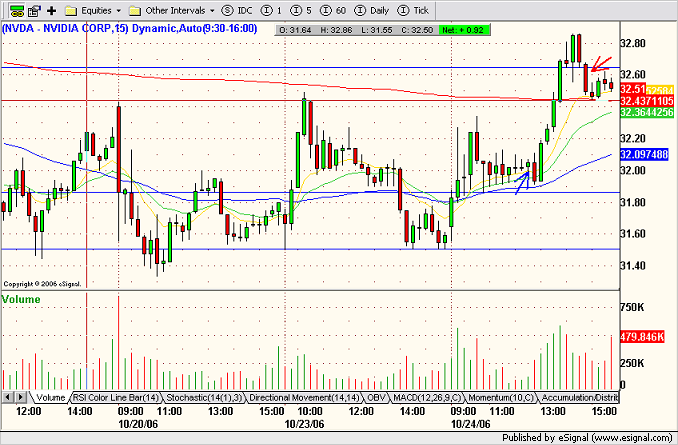 I took a low risk, long entry on NVIDIA Corporation (NASDAQ: NVDA) and it moved against me shortly after I got in. I had set a strategic stop just pennies below the low of the sixth bar hammer. Luckily, I did not get stopped out because the stock reversed and rallied on high volume. My position was stopped out just above $32.60 for a $0.60 gain.
Monday, October 23, 2006
Technical Trade Idea - Citrix Systems, Inc. (Public, NASDAQ:CTXS)
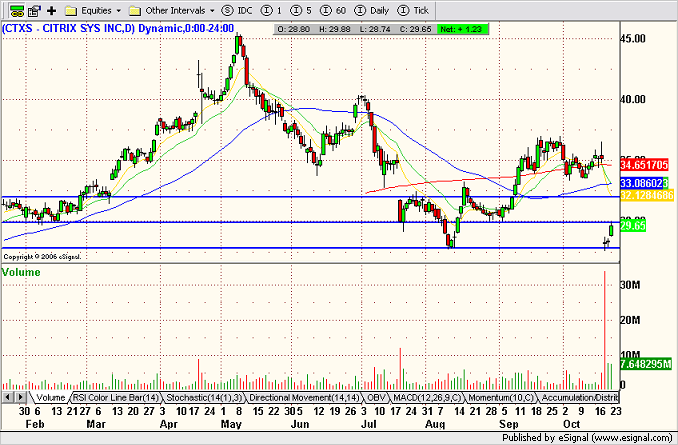 After capitulating on lower than expected earnings last week, CTXS has bounced back to a notable resistance area ($30.00). Will it break resistance and rally back towards $32.00 and its declining 10 day EMA, or will it reverse and head south again?
NASDAQ Technical Picture - Cup & Handle on the Monthly Timeframe
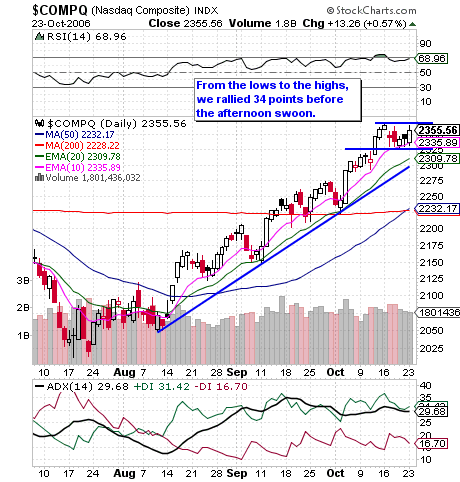 After gapping down on the open, the NASDAQ managed to rally 34 points before trailing off in the afternoon. Better earnings and lower oil sparked some buying interest shortly after the open, however, the NAZ was by far the weakest of the major equity markets. AH we had some positive reports from NFLX and AMGN.
Earnings tomorrow include TZOO before the bell and AMZN after hours. The two day FOMC meeting begins tomorrow with a statement scheduled for 2:15 EST on Wednesday afternoon.
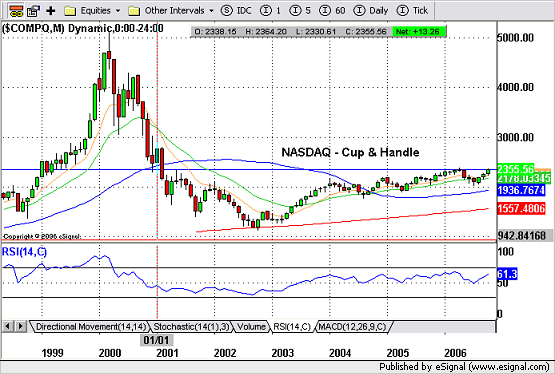 We're not out of the woods yet, but it appears that we have a bullish cup & handle pattern on the NASDAQ's monthly timeframe. Still, we have a lot of resistance dating back to 1999 and 2001 before we can declare victory.
Dummy Trade of the Day - NVE Corporation (Public, NASDAQ:NVEC)
 As usual, I ran my gapper scan shortly after 10:00 EST and I was pleasantly surprised to see two very familiar names show up - AKAM and NVEC. After a quick look at the daily timeframes, it was obvious that NVEC was breaking out whereas AKAM was running into resistance from the 20 day EMA. I waited for a low risk entry and exited after NVEC carved out a lower high in the afternoon. The NASDAQ market felt very weak early in the afternoon and I didn't want to push my luck. The chart does not look like much, but I managed to take out $1.30 on the trade.
One thing I should have done was calculate the Fibonacci extension on NVEC. I usually use a combination of resistance and the Fibonacci extension to calculate my target but I was lazy today. The 50% Fibonacci extension would have given me $42.60 as a target. My exit was $42.35. Discipline.
My only other trade was another long on CAL as it consolidated its gap. My entry was a low risk dummy entry on the fourth 15 minute stick. I exited this position before lunch with a small profit because I didn't want to risk a scratch and the stock felt sluggish after last week's big run.

Sunday, October 22, 2006
Trading Gaps Dummy Style - Part I
I've been getting a lot of email and comments concerning my dummy style gap trades lately, so I thought it might be useful to write a post and answer all of the queries at once.
My objective in gap trading is to profit from high volume (momentum) after the stock consolidates the opening gap. The consolidation usually presents a low risk entry opportunity ie. dummy entry point. For the purposes of this post, I am excluding gap fade and gap fills. In other words, I'm concentrating on long gap ups and short gap downs.
Sources I use for identifying potential gapper candidates:
1.Pre-market top trade counts from my IB (Interactive Brokers) platform;
2.Esignal;
3.Briefing.com gapping up and gapping down lists found in the Live -In Play section or posted daily over at Trader Mike's blog in the morning Watchlist post.
4.Quote.com - Unfilled Gaps
5.Trade-Ideas gapper scans;
6.Stockcharts.com Realtime Extra - User defined scans.
For more sources check out Trader-X's list.
I've received a lot of questions regarding stockcharts.com as a scanning tool. Again, I just want to point out that Trade-Ideas is my preferred scanning tool, however, due to limitations of the workplace, I use stockcharts.com because it is available on any computer through the internet and requires no downloads.
Scans
I run two scans as follows:
Gap up - Average daily volume > 300k; Price > $10.00 and < $150.00; and today's open > yesterday's close.
Gap down - Same as the gap up for volume; Price > $20.00 and < $150.00; and today's open <> low.
For some reason, the gap down scan usually results in a much longer list than the gap up. I'm still looking for ways to filter out some of the noise and concentrate on the big volume movers.
The great thing I like in stockcharts.com is that I can download the scan results into two separate folders and quickly run through all of the charts on both the daily and 15 minute timeframes.
Identifying Good Candidates
The criteria I use for spotting high probability gapper setups for long entries are:
From the daily timeframe:
Ideally, the gap up has broken out of a consolidation pattern or a base on the daily timeframe. I avoid stocks that are moving up towards a downsloping 50 MA if the MA is too close as it will act as resistance and could force an early exit. Flat MAs are less of a problem especially if the stock has been in a bullish base for a long period of time. The daily view is a good place to identify price targets from resistance areas. If the stock is hitting 52 week highs, I go back to the weekly or monthly timeframe.
From the 15 minute timeframe I look for:
High volume relative to recent volume levels.
Candlestick patterns - Wider bullish sticks on the open followed by a tight consolidation in the upper part of the opening range or, an orderly pullback towards the rising 10 period EMA. I define an orderly pullback as small sticks with little or no overlap of the real bodies on declining volume.
The other pattern to look for is the shallow rounded base consolidation pattern that Tom C. and Trader-X refer to as the "U". The shallow base is a very bullish setup on its own, but combined with a gap up, it can be particularly powerful.
Things I try to avoid:
Extremely wide opening ranges and low volume.
Choppy price action and bar by bar shakeouts.
In Part II (later this week), I will discuss my entry and exit techniques.
Wall Street Warriors - Eight part Documentary Series
INHD upstart men's network MOJO is rolling out Wall Street Warriors, an eight-episode documentary series following the lives of Wall Street traders and hedge-fund managers. Debut is scheduled for October 22nd. That's tonight!
Catchy Title - Watch the trailor
Catchy Title - Watch the trailor
Friday, October 20, 2006
Dummy Trade of the Day - Continental Airlines, Inc. (Public, NYSE:CAL)
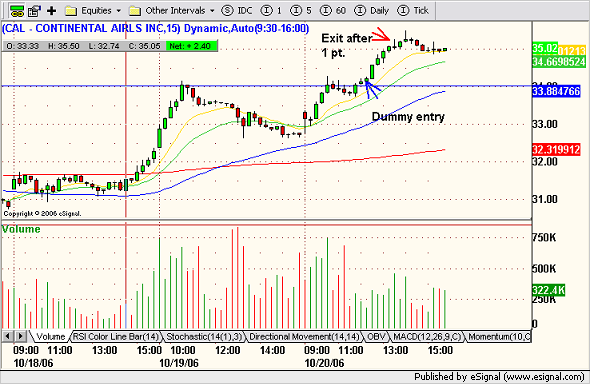 I found CAL through a gapper scan and was planning to buy it if it reversed off of its rising 10 period EMA but I was away from my desk at the time so I waited to see if the next bar would close above support and then I went long. I didn't want to push my luck on options expiration so I booked my profit after a 1 pt. gain. A quick look at the monthly chart below shows that CAL rallied right up to resistance dating back to 2002.
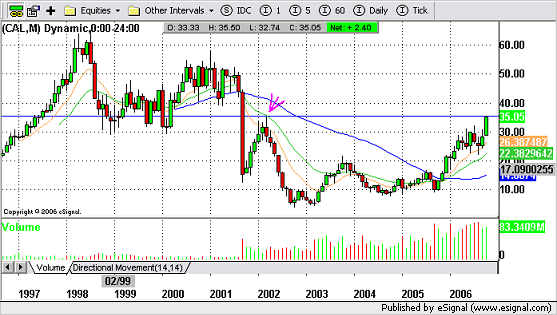
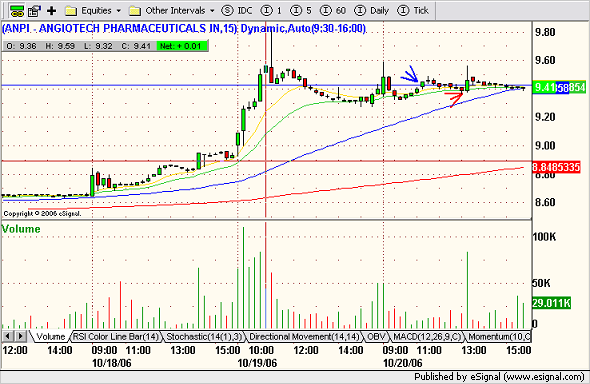
ANPI was a left over from yesterday's gapper scan. I didn't trade it yesterday, but today I tried a low risk entry just above a pivot point, but it failed. Small loss.
Technical Trade Idea - F5 Networks Inc. (Public, NASDAQ:FFIV)
 FFIV carves out a NRB on pivot point support. Could foreshadow a reversal.
Thursday, October 19, 2006
Wall St. Warrior in the Top 10
Trader Mike's Top Traffic Sources - Within a month or so of starting this blog, I was privileged to get a links with my two favorite bloggers - Trader Mike and Trader-X. They put me on the day trading blogging map and I am extremely grateful. Thanks guys!
Equity Investment Ideas - Top Blog List - Thanks for the mention Yaser!
Equity Investment Ideas - Top Blog List - Thanks for the mention Yaser!
NASDAQ Technical Picture - Narrow Range Trading Leading into Options Expiration
 A narrow range trading day just ahead of options expiration. The SOX managed to close on its 50 day MA as discussed here last night. BRCM and XLNX up in AH trade but SNDK and FLSH are way down on disappointing earnings. GOOG had a big beat tonight - EPS 21 cents ahead of Reuters estimates and a 70% increase in yoy revenues.
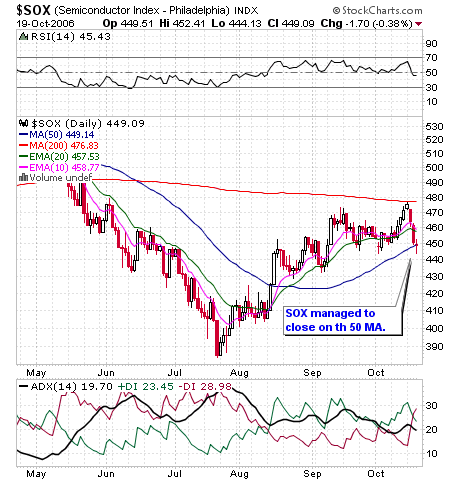
Dummy Trade of the Day - CONSOL Energy Inc. (Public, NYSE:CNX)
 CNX came to me from a gapper scan. I liked the volume so as soon as it reversed off of support from its rising 10 period EMA, I took a long position. I made my exit when it became clear that CNX was carving out a lower high. From the daily timeframe it appeared that the June closing low ($35.59) was acting as resistance.
Trade of the Day - United States Steel Corporation (Public, NYSE:X)
 X tagged its 10 day MA on the daily timeframe and immediately reversed on high volume. Once it had taken out its OR high I was looking to get long. My entry was just above the 200 MA. I didn't place a hard stop , but I would have taken a loss if X had breached the 200 MA on a closing basis on the 15 minute timeframe. I booked 50% of my profit after a 1 pt. gain and moved my stop up to yesterday's low. X carved out a bullish engulfing bar on the daily timeframe and I sold my remaining position on weakness late in the session.
Wednesday, October 18, 2006
NASDAQ Technical Picture - SOX Sells Off
 The NASDAQ filled its gap on the open and then the sellers immediately took over. Since I posted the SOX chart on Monday, we've had two days of profit taking. However, now we are coming into support of the rising 50 day MA. A close tomorrow on or above the 50 MA for the SOX is important. I will be looking to take advantage of a potential bounce in strong semi names such as NVDA if notable support holds and a reversal setup presents itself.
AAPL and NVEC are up in AH trade, AMD is down and CTXS are getting kicked into the gutter.


Dummy Trade of the Day - Canadian National Railway (USA) (Public, NYSE:CNI)
 I ran a gapper scan shortly after 10:00 EST. After reviewing all of the charts from the scan, I decided that CNI had the best potential based on volume and narrow consolidation of the gap up. I took a low risk entry following a NR bar which had just carved out a higher low. My target was the 50% Fibonacci extension around $45.50. I knew that there was resistance at $45.00, but I was hoping that we could take it out. I was wrong, I took 50 % profit just below $45.00 and was stopped out on the balance. CNI had a nice, orderly pullback to the rising 20 period MA so I was able to take a second low risk entry into the close. As soon as price tagged $45.00, I booked my profit.
Trade of the Day - Yahoo! Inc. (Public, NASDAQ:YHOO)
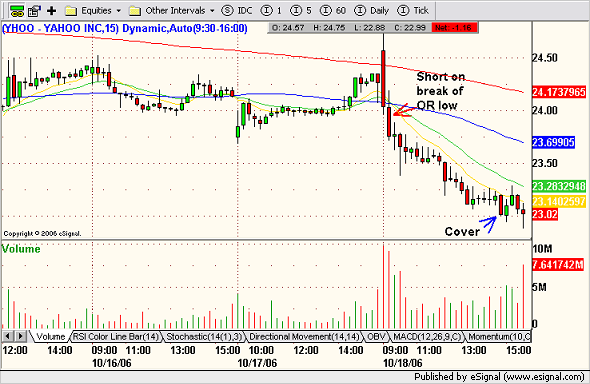 YHOO gapped up on the open but quickly reversed course as sellers took over on heavy volume following last night's dismal earnings report. I took a short position on a break of the OR low and covered as soon as price reached $23.00.
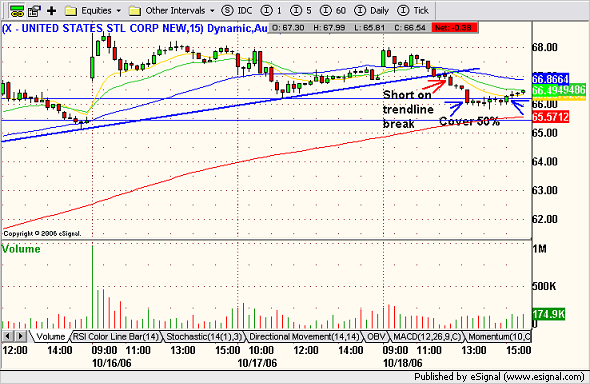 I noticed that X was testing its trendline just as I was about to go for lunch, so I stuck around and took a short position. My preliminary target was yesterday's low, followed by a gap fill to Friday's close (both of these targets are mapped out by the blue lines). I covered 50% of my position about 10 cents below my first target and held the balance hoping to reach my second target. I covered the balance of my position when it appeared that X might rally into the close.
Tuesday, October 17, 2006
Research In Motion Limited (USA) (Public, NASDAQ:RIMM) on WallStrip
The second installment of WallStrip focuses on Canada's biggest tech success story du jour - RIMM, or the Canadian ticker symbol RIM as Lindsay Campbell ( any relation to Neve - Scream / Party of Five - Campbell?) prefers.
NASDAQ Technical Picture - High Volume Gap Down

The NASDAQ gapped down on on Goldman Sack's downgrade of INTC amid worries that tech stocks are overvalued. AH earnings from INTC, YHOO, and MOT were not rich enough so the overall market should remain weak. It could be another stock picker's earnings season with stars like ILMN and RIMM heading north to challenge resistance and all time highs, while the overall market drifts back to reality. It's too soon to tell for sure, but it's my gut feeling.
Tomorrow's economic data includes CPI and housing starts BTB and crude inventories at 10:30. AAPL and AMD are among the bellwether tech companies reporting AH.
Dummy Trade of the Day - Global Crossing Ltd. (Public, NASDAQ:GLBC)
 Daily Timeframe
 15 Minute Timeframe
I ran a gapper scan shortly after 10:00. After sifting through all of the hits, I decided to focus on three stocks, LEA, SNPS, and GLBC. I finally decided to go with GLBC because of volume and the narrow consolidation. I took a long entry following a NRB with the 10 period MA coming up just below as support. I took 50% of my profit after a 1 pt gain. My target was $24.80 - $25.00 based on the 50% Fibonacci extension (from yesterday's low to the OR high) and the next resistance level on the daily view, however, that target proved too much under today's market conditions.
This was my only trade today. When I saw the weakness on the open, I was hoping for a bounce off of support on some of my usual suspects, but most stocks just meandered sideways after the initial drop.
Monday, October 16, 2006
NASDAQ Technical Picture - Feels Toppy
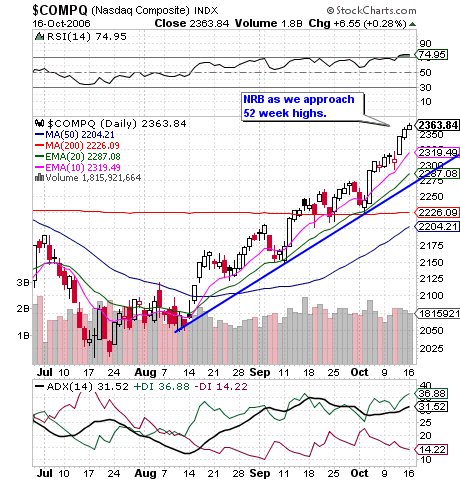
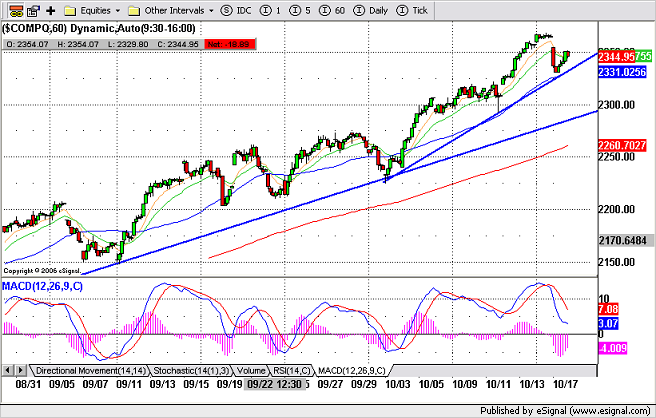
 The NASDAQ peeked within the first hour of trade and managed to trade sideways for the rest of the day. Still, we are inching ever closer to 52 week highs. I'm going to be posting the 60 minute timeframe along with the daily going forward so that we can monitor the trendline. Notice how the MACD crossed over on the shorter timeframe today.
Earnings season ramps up tomorrow AH. Economic data to watch for tomorrow BTB are PPI and Capacity utilization.
Below is chart of the SOX - Notice the proximity of price to the 200 MA.

Trade of the Day - Energy Conversion Devices, Inc. (Public, NASDAQ:ENER)
I was guided by last night's watch list in most of my trading today. The only real success of which was ENER. All of my picks gapped up above Friday's high on the open except ENER. However, after the OR, JOYG, SNDK and BRCM generated only NR, intraday trading opportunities.
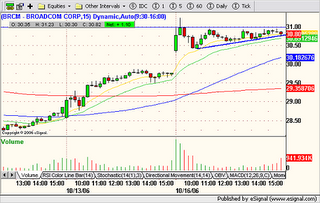 BRCM never triggered because I was looking to go long on a break of $31.00 as it appeared to be forming a narrow ascending triangle.
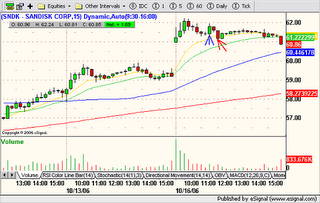 I took a long entry on SNDK after an orderly pullback towards the rising 10 period MA. The bar prior to my entry was NR and had just carved out a higher low. I was stopped out shortly after on a failure.
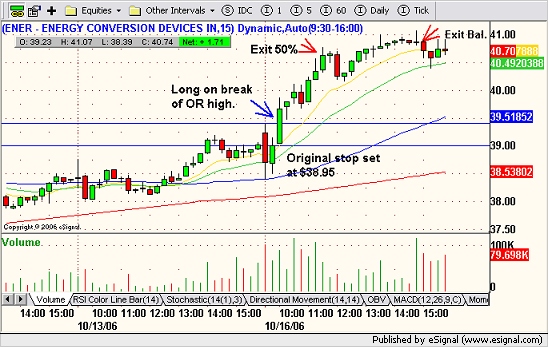 ENER was a long on a break of the OR high with a stop just below $39.00. I took 50% of my profit after a 1 pt. gain and exited the balance after it failed to take out $41.00 on its second attempt.
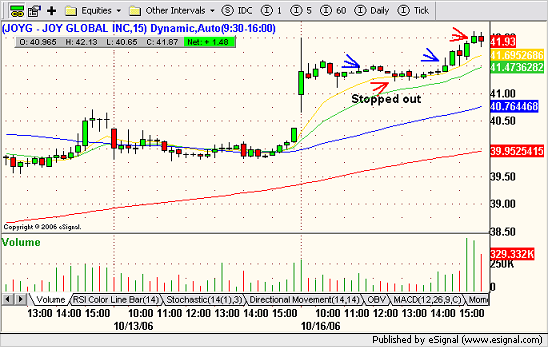 JOYG was a long as it took out a very NR bar just above the 10 period MA in late morning trade. I set my stop 10 cents below the previous bar and was stopped out by a few pennies during lunch. A more strategic stop would have been the low of the hammer (6th bar on the 15 min. timeframe). I eventually ventured back into JOYG as it took out minor resistance at $41.50. As soon as it traded up to $42.10, I moved my stop up to $42.00.
 BRCM never triggered because I was looking to go long on a break of $31.00 as it appeared to be forming a narrow ascending triangle.
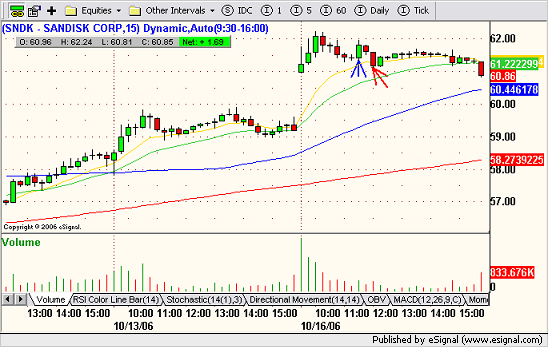 I took a long entry on SNDK after an orderly pullback towards the rising 10 period MA. The bar prior to my entry was NR and had just carved out a higher low. I was stopped out shortly after on a failure.
Subscribe to:
Posts (Atom)