Thursday, November 30, 2006

Chart Analysis Request - Sandisk Corp. (Public, NASDAQ:SNDK)

Posted Wednesday November 29th.
Appreciate if you could do a post-morton on this trade for me.I traded SNDK on both 5 min and 15 min chart. Looking at the daily chart, there is strong support at $44 and chart also seems to be potentially forming double bottom.2nd bar on 15 min chart printed a hammer. Entered long on break of 2nd bar high with stop below 2nd bar low. Target OR high.Stock went up but seemed to stall at previous day low. Held on the trade till stop loss triggered at 12th bar.Pls advice if there's anything wrong with this setup or with my entry / exit. Thank you.

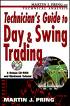
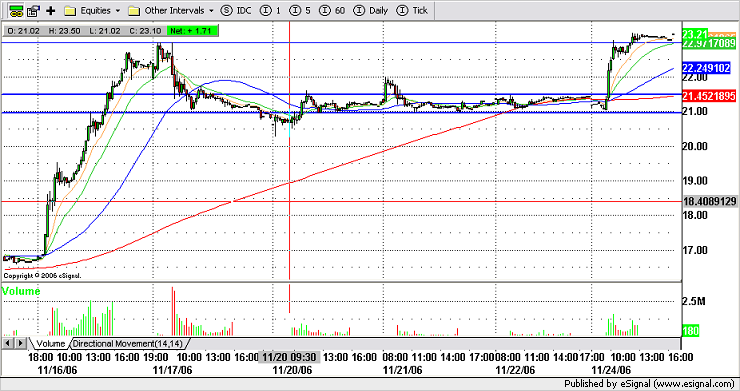
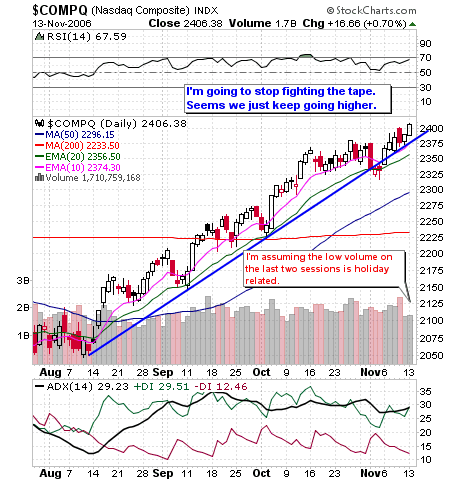
Okay, so lets look at the daily timeframe first. This is the SNDK chart prior to the open Wednesday.


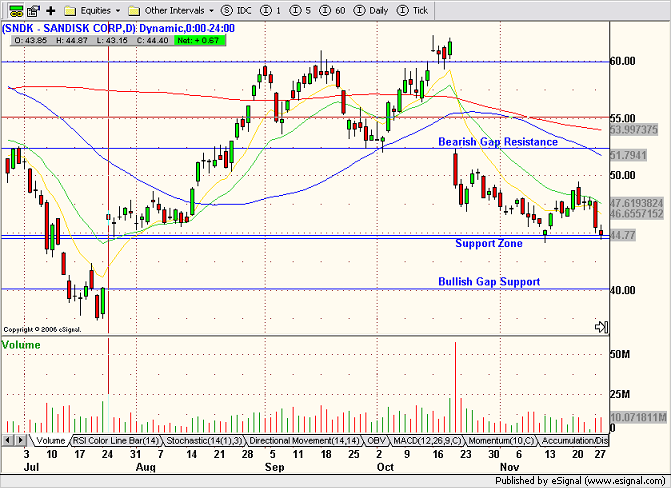
The key take away here is that SNDK is sitting on the upper support line of a bullish gap support level. Going into the trade that support level has been recently tested twice and held.


Now let's look at the 15 minute chart of the actual trade:

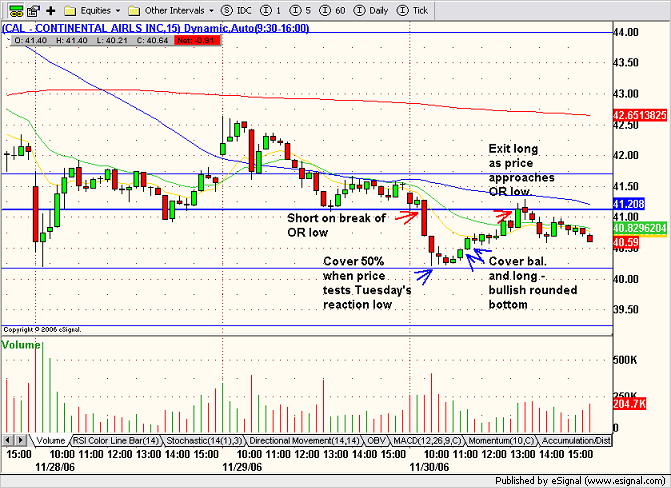
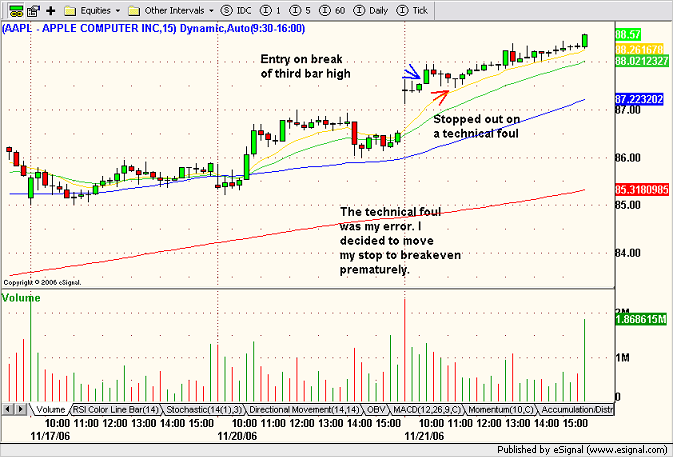
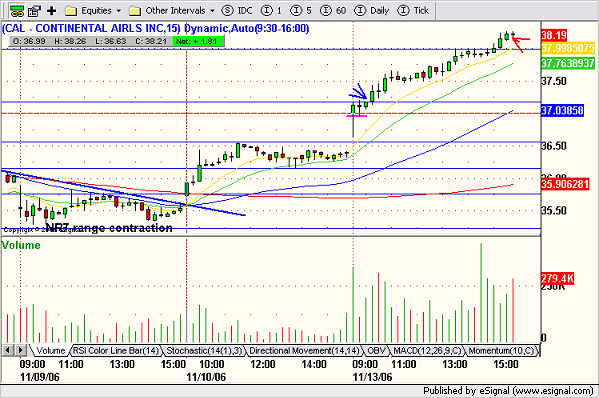
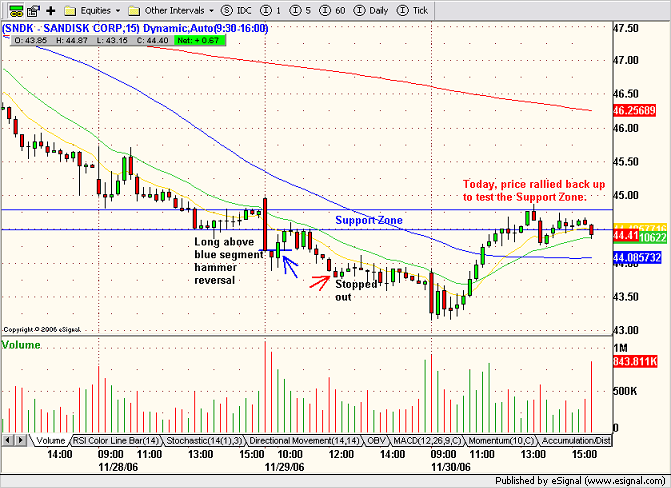
The key take aways here are the breach of the support zone (SZ) on the opening range (OR) bar. Also note, the angle of the downward sloping MAs. The second bar carved out a hammer reversal and a long entry was taken on a break of its high. Price rallied back up the the SZ tagging the downsloping 20 MA, but closed just on the periphery of the SZ. Notice how the rally took place on declining volume. After pulling back, price tested the SZ a second time before retreating back into its bearish trend.


So the long entry was good as a scalp, but when the first test of the support zone failed, at least 50% profit should have been booked at the support line. The second failure is a red light and the stop should be tightened to breakeven.


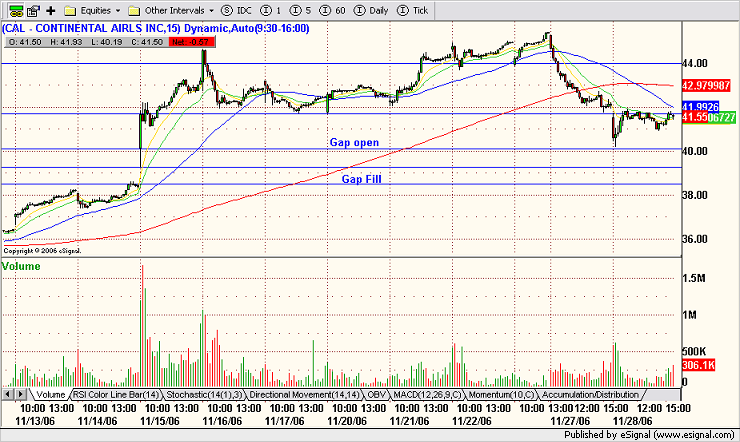
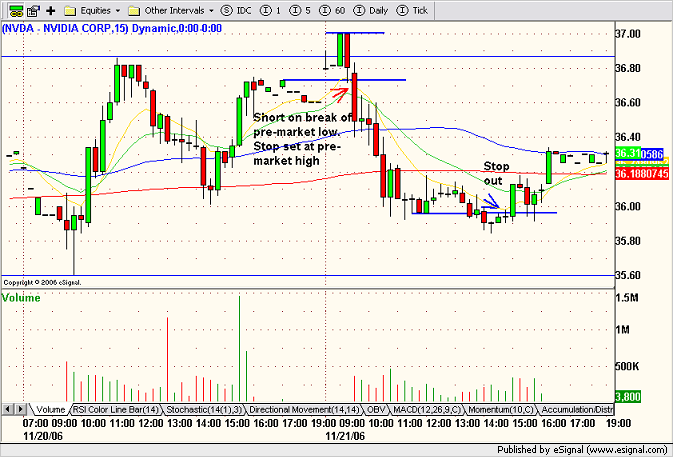
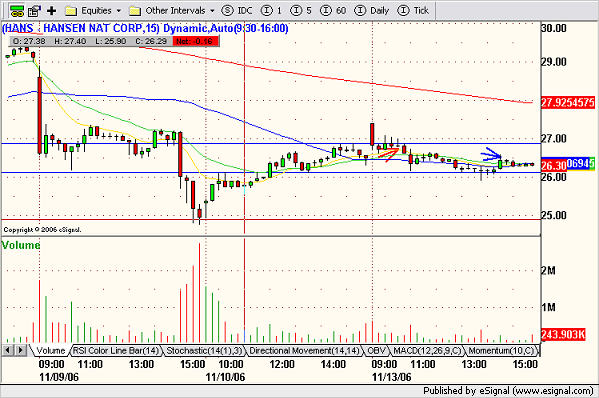
The reason I'm calling this a support zone is because on both tests November 13th and 28th, SNDK, spent hours trading within the zone. I slotted these lines in last night when I read Zen's comment. Just to show you the importance of drawing in all of your support and resistance lines before entering the trade. Let's look at what happened today.


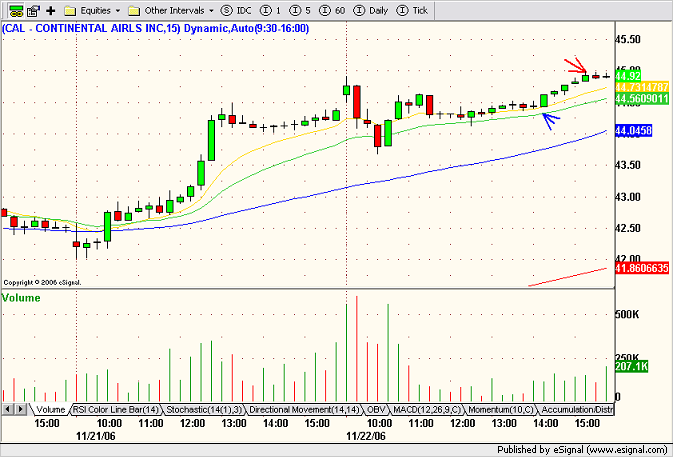
Okay, so today's open was pretty similar to yesterday's, except about an hour into the session, SNDK started to carve out a bullish rounded bottom and the second half that bottom was on rising volume. A low risk entry could have been taken on the 7th bar open with the SZ as the target.

Dummy Trade of the Day - Continental Airlines, Inc. (Public, NYSE:CAL)

CAL was weak coming out of yesterday's session. This morning it gapped down on the open. I shorted just as it was breaking the OR low. My initial stop was just above the OR high. I covered 50% as price tested Tuesday's reaction low. I was hoping for further weakness, but when I noticed a bullish rounded bottom taking shape, I immediately covered the balance of my position and waited for the next stick to open higher for an entry long. I exited the long position as price rallied back up to test the OR low.

Another test of this low, could see a successful break lower so put this one on your watchlist for tomorrow. Support and resistance often hold on the first two tests, but it has been my experience that the third test succeeds 80% of the time.

Pre-Market - Thursday November 30th

Indication on RMBS is that news released last night about PS3 inclusion was already well known. Stock continues to go up anyway. Not making a call, just letting you know the situation. Stock now trading at $22.68.

Jefferies notes that the Internet and New Media segment has had a strong performance in the last few weeks, with many stocks approaching their price targets, driven by early signs of positive seasonality and good 3Q results. The firm continues to see upside in Aquantive (AQNT 23.38), Google (GOOG 484.65) and Yahoo (YHOO 27.04); they are buyers of VCLK, NFLX, RATE, VPRT and SFLY on pullback.

Yet another AAPL target increase - Needham raises their tgt on AAPL to $115 from $90 based on a more realistic reading of the switch rates among Windows users that should ensue from the Mac's forthcoming ability to run Windows.

Cautious on semis - Susquehanna say with semi equipment stocks continuing to perform relatively well despite negative data flow, they review their near-term cautious stance on the group (based on deteriorating industry fundamentals). Firm notes that inventory issues still linger across the semiconductor landscape, with the problem particularly acute in microprocessors (where the INTC/AMD price war continues), and analog (where the handset and high-performance analog markets seem poised to continue to disappoint relative to outsize growth expectations). They expect this capacity overhang to ripple quickly through the supply chain in the form of more severe wafer start reductions in C4Q06/C1Q07 at foundries such as TSM and UMC, and believe that plans to idle tools or even entire production lines over the year-end holiday season, as well as the Lunar New Year, are already in place. Firm notes that NVLS is their favorite short ahead of mid-quarter update on Dec. 4.

So far same store sales are disappointing as a whole.

Courtesy of Briefing.com

Wednesday, November 29, 2006

Support and Resistance

A few days ago, David asked me for some knowledge sources regarding support and resistance and I recommended Stockcharts.com - chart school as well as two books that cover the subject thoroughly:

Martin Pring

John Murphy


Here's another good article "Support and Resistance Reversals" that I found courtesy of Trader Mike's daily feed. Thanks Mike!

Trade of the Day - None

Not for lack of opportunity. I was stalking the metals sector early on and was hoping to get long Titanium Metals Corp. (NYSE:TIE) after the gap consolidation. Unfortunately, the consolidation took too long and I wasn't around when the break took place. Here are the charts - 15 minute and the 5 minute, the latter accentuates volume contraction during consolidation and expansion on the price break. Also check out the charts for IPS and X. Now that tech is losing its leadership, XLB might offer some strength.


Notice how sharply TIE fell after it failed to stay above $31.00. I try to always move my stop just above the dollar number in late day trading because when price fails at the dollar level, it can cause a lot of slippage.


On another note, if anybody followed up on my pre-market post - (NASDAQ:MSCS) - Insider Buying - here's the chart:

Pre-Market - Wednesday November 29th

Another slow news day.

Momos in play:
AAPL up in pre-market - another target raised, this time at Bear Stearns; NYX sellers pushing this one down on JP Morgan downgrade.

Very nice-sized insider buys posted last night for MSCS, it'll be one to keep an eye on again today. CEO buys 115k shares in the $13.43 to $13.60 range. President of the co buys 20k shares at $13.52. We see the insider buys as important, given that we see MSCS as a value play, and a possible acquisition. Thinking this could be the day the stock closes above resistance at $14. - Courtesy of Briefing.com


Tuesday, November 28, 2006

Trade of the Day - Continental Airlines, Inc. (Public, NYSE:CAL)


The first chart is a wide range view of CAL over the last few weeks. The blue lines are key support and resistance levels. Of course, when support is broken, it becomes resistance. So yesterday's support is today's resistance.

The second chart is a closer view of the same 15 minute timeframe. CAL gapped down on the open and quickly fell towards the gap open support level dating back to November 15th. The next bar signaled indecision and the third bar moved slightly higher. Volume on the second and third bars was very bullish, so I took a low risk, long entry as the fourth bar opened up. My target was a gap fill. As soon as price tagged the downsloping 20 period EMA, I took my profit.

I shorted CAL on a lower high about an hour later. Midday it formed a perfect hammer, signaling a potential reversal. I immediately, tightened my stop to breakeven just in case and I was stopped out on the next bar. I waited to see if another long entry would setup, but decided to call it a day when the stock came into a third wave of weakness. The chop chop game is a no win situation when it comes to trading.

Pre-Market - Tuesday November 28th

WSJ reports on Amazon.com's Top 10 selling list for electronics yesterday, seven of the 10 products were digital media players. Nowhere did the Microsoft or Zune names appear. "That's a pretty good indicator of consumer interest," Michael Gartenberg of industry group Jupiter Research said yesterday, one of the busiest days of the year with online shoppers. The 30-gigabyte Zune player from Microsoft was on the Top 10 list of Amazon (AMZN) for several days after its release on Nov. 14 before dropping off. But yesterday, the most popular model of the Zune, the black version, was at No. 76. The Top 10 digital media players included six iPods from top-seller Apple Computer (AAPL) and one MP3 player from SanDisk (SNDK). "The product [Zune] wasn't particularly attractive. At the end of the day, you put it on a shelf and it just didn't compare," said Rob Enderle of research firm Enderle Group. Sales of Zune in the first week after the Nov. 14 launch were "exactly within our expectations," a Microsoft spokeswoman said. She added that she is still awaiting information for holiday weekend sales.


WSJ reports Google's video-sharing Web site YouTube agreed to bring its popular content to cellphones through a partnership with Verizon Wireless (VZ)(VOD), a move that will give the wireless carrier a selling point for its subscription multimedia service and a temporary edge over competitors. Verizon Wireless will have exclusive rights to YouTube's mobile content for a "limited" time. The cos won't say for how long. Over time, YouTube is likely to seek similar partnerships with the other leading cellular operators, including Cingular Wireless (T)(BLS), Sprint Nextel (S), and T-Mobile USA. Steve Chen, chief technology officer and co-founder of YouTube, declined to comment on discussions with other wireless carriers but said the co would "roll out more exciting partnerships and features for the mobile user over the coming year."

Courtesy of Briefing.com

My note: Lack on any real compelling news items so far this morning. Some stocks such as AAPL are trading up in pre-market and may be setting up for more short plays.

Monday, November 27, 2006

Technical Trade Idea - Akamai Technologies Public, NASDAQ:AKAM)

NASDAQ Technical Picture - Profit Taking was Overdue

The bulls, myself included, have had a nice run lately, and now its time for a healthy dose of profit taking. The markets and most stocks on my radar finished the session on their lows, so I expect that we are in for more selling tomorrow. Wednesday's hanging man foreshadowed a correction but who was paying attention. All tech sectors participated in the slide paced by networking, hardware, and disk drives. The NASDAQ was the hardest hit of the majors, not surprisingly as it led the way up, it will also lead down. However, this is a long overdue corrective pullback to make room for the Christmas rally ;).


Tomorrow's economic calendar includes durable orders at 8:30 EST, followed by Consumer confidence and existing home sales at 10:00.

Below is a 60 minute view of the NASDAQ with key support/resistance levels. Also, look for divergence of the RSI and MACD ahead of a potential reversal (bounce).


Trade of the Day - Continental Airlines, Inc. (Public, NYSE:CAL)

The markets have been overbought for quite some time and today was the day for some major profit taking. There was no real catalyst going into the session, but the first few bars were very persuasive. I noticed that all of the recent momo stocks were getting beat up pretty bad, so I took my biggest winner on the month and started stalking it for a low risk, short entry. I should have probably shorted it just before it broke through $44.00 as it would have been easier, but I managed to short at $43.85 with an initial stop at $44.25. I missed my planned exit near $42.00, so I covered on a minor bounce at $42.35. Notice how the selling took place on relatively high volume throughout most of the day, compared to the low volume accompanying the mid afternoon bounce.

Pre-Market - Monday November 27th

ThinkEquity raised their tgt on AAPL to $110 from $100, saying their proprietary "Black Friday" survey of Apple Retail stores across the nation indicates likely upside to their Retail Store rev est of $1.45 bln for 1Q07. Firm believes that AAPL's Retail Store is a clear differentiator and a significant catalyst for further CPU share gains and profit margin expansion.

Barron's mentions possible takeover targets in the semiconductor industry: Potential candidates in the tech sector, according to CreditSights, include cash-rich analog semiconductor companies like Linear Technology (LLTC), Maxim Integrated (MXIM) and Analog Devices (ADI), as well as Altera (ALTR) and Xilinx (XLNX).

Soliel downgrades X (US Steel) to Hold from Buy based on valuation. The firm says while a possible breakup value could approach $100 a share, it is their experience that companies do not trade at the break up value and possible acquirers won't pay full value for a company.

Google Overvalued? Barron's reports shares of Google (GOOG) appear due for a correction based on slowing growth and bloated expenses. Analysts on average expect the co to earn $13.70 in 2007, up from an estimated $10.31 this year. That's a prospective gain of 33%, which looks great until compared with the 81% increase in earnings that Google is on track to produce in 2006. In either case, those estimates are inflated. They ignore about $1 a share of stock-option expense, while giving the co about $1 a share of credit for the interest earned on its $10.4 bln cash hoard. If analysts accounted for option expense and ignored interest income, '07 estimates would shrink to roughly $11.70 and the p-e multiple would climb to 43. Also, the price advertisers are willing to pay for search keywords has fallen. The average price paid to buy a search word across the Web in the second quarter -- $1.27 -- has declined 11% from the start of the year and 34% from the peak of $1.93 in April 2005. So far, companies have made up the difference on volume, but it's a trend worth watching. Fred Hickey, editor of the High-Tech Strategist newsletter and a Barron's Roundtable member, is convinced the consumer is slowing. He expects the slowdown to hurt Google's advertising and stock price, too. "I know (Google stock) isn't worth $500 a share," he says.

WSJ highlights ENER, reporting that Stanford R. Ovshinsky has spent 40 years -- and millions of dollars in backing from various partners -- pursuing his dream. He wanted to build a huge machine that would make giant sheets of material that can generate solar power. Today, Mr. Ovshinsky, 84 years old, finds himself running his factory at full capacity and overwhelmed with orders. His company, Energy Conversion Devices (ENER), is the largest U.S.-owned maker of photovoltaic materials, which convert sunlight to electricity. The co is a pioneer in an exploding global industry selling $15 bln a year of what's called "PV." Mr. Ovshinsky, a thin, nattily dressed inventor who never progressed beyond high school, is a big reason why the U.S. remains in this high-tech race. He has a six-month backlog of PV orders, selling about half his production to Germany, and is building three new plants. His PV is thinner, cheaper and more flexible than that of many competitors, and can be used directly as a roofing material.

Goldman adds Celanese (CE) to their Conviction Buy List. The firm also removes Air Products (APD).

HOFF - Horizon Offshore upgraded to Strong Buy from Outperform at Raymond James- maintain $29 tgt, based on valuation (15.31 )

Courtesy of Briefing.com

Friday, November 24, 2006

Trade of the Day - Rambus Inc. (Public, NASDAQ:RMBS)

My strategy going into this holiday shortened session was a little different than usual. Rather than running a gapper scan at 10:00, I wanted to be in my trade by 10:00. Also, because of the pre-market selloff, I was looking for stocks that would bounce off of support shortly after the opening gap down.

After seeing Tom C's trade of the week on Trader X blog last week, I added RMBS to my short-list of momo stocks with potential for further upside. In the early going this morning, I was tempted to long CAL, but at the last minute decided to go with RMBS because it had a cleaner setup, ie. it gapped down to a well defined support level and shortly after the open, it offered a low risk entry on the 5 minute timeframe.


The wider range view, shows how well defined the support/resistance parameters were going into the trade.


My entry was a break of Wednesday's high. My original stop was just 25 cents. I added to my position after RMBS consolidated the first leg up. This was done on a one minute timeframe where the break was much more obvious than on this 5 minute chart. I then moved my stop up to $22.10 which was the low during consolidation. I exited 50% when last week's resistance was tested and the balance was sold into the close. All in all, I applied low risk dummy trading rules to a 5 minute timeframe in the context of clearly defined support/resistance levels.

If you get a chance, look at the daily timeframe and notice how Wednesday's stick looks like NR7 - range contraction/range expansion.

Wednesday, November 22, 2006

Dummy Trade of the Day - Yahoo! Inc. (Public, NASDAQ:YHOO)

YHOO showed up on my gapper scan along with a number of retailers. I decided to stick with the more familiar name. After consolidating the opening gap and successfully testing yesterday's high as support, YHOO formed a bullish piercing line candlestick reversal pattern on the fourth 15 min. bar. Aggressive buyers could have entered on the 5th bar, but I waited until the OR (opening range) high was taken out. My entry was on the 7th bar, following the NR7 bar. My exit was a little premature. I guess I wasn't expecting such strength into the close on the pre-holiday session.

I took a very low risk entry on one of my favorite momo stocks this afternoon. After a volatile morning session, CAL settled into some NR trade along its slightly upward sloping 10 period MA. In mid afternoon, I felt a sudden uptick in volume on a NR bar and decided that if CAL was going to test its morning high, I wanted to be there. My risk was only about 10 cents and my reward was half a point.

(NASDAQ:MSFT) Xbox 360 Update

Xbox 360 'Gears of War' hits 1 mln copies sold; fastest selling original Xbox game of all time

According to a MSFT statement, "Gears of War" continues to emerge throughout the world ahead of the holiday sales rush, the Xbox 360 juggernaut has sold an impressive 1 million copies world-wide in just its first two weeks of release—elevating the game to the fastest-selling title of 2006 and fastest-selling original Xbox game of all time. "Gears of War" has also driven new members to the (Xbox live) network, as paid registrations per day have skyrocketed more than 50 percent since the game's launch. (Briefing.com note: Video game names ERTS, TTWO, THQI, ATVI and GME benefit from Gears of War launch because this game is a console seller (ie: People are buying the Xbox 360 to play this game) because the game is exclusive to Xbox 360.) Courtesy of Briefing.com

Pre-Market - Dell Inc. (Public NASDAQ:DELL)

Thomas Weisel notes preliminary results were in-line on rev expectations but beat on EPS. Firm says storage rev growth was the highlight of the quarter, which grew 27% y/y. On the negative side, desktop rev declined 9% y/y while notebook rev was up only 8%y/y. Server rev grew a solid 8%y/y. They believe higher gross margin was the main driver for EPS upside. Gross margin of 17.1% was 141bp higher than their est of 15.7%. THey say it appears that DELL walked away from lower margin business in both desktops and notebooks, and they note that enterprise was strong, which carries higher margins. Firm believes that DELL is benefiting from the AMD adoption in its PCs... ThinkEquity notes DELL reported better-than-expected revs and a much better than expected EPS number. Strong gross margins were responsible for the better bottom line, but firm does not believe this is sustainable going forward. Competition in the PC sector continues and an increasing percentage of revs are being derived from lower-margin emerging market business... Robert Baird says that although attention on DELL's profitability should fuel recent optimism driving shares, at 14x cash adjusted C07E EPS, firm feels valuation is not overly compelling given questions on growth, longer-term margins, better executing competition, and accounting issues. Firm also raises their tgt to $26 from 24 based on 11x EV/C07E EBITDA... Friedman Billings says gross margins rebounded strongly, leading them to now suspect that the July quarter was a cleanup and that extended warranty margins are in better shape than they thought. This, in turn, means that the trajectory of margin recovery should be steeper than firm had estimated. Firm believes the major questions around bottoming margins have been answered and that Street ests and valuation will rise accordingly... (Briefing.com Note: Credit Suisse raised their tgt on DELL to $25 from $18. Bear Stearns upgraded DELL to Outperform from Peer Perform. ) Courtesy of Briefing.com

Tuesday, November 21, 2006

Dummy Trade of the Day - NVIDIA Corporation (Public, NASDAQ:NVDA)

NVDA traded up in pre-market but started showing a lot of weakness just prior to the open. This is a DOA (dead on arrival) setup. Short on a break of the pre-market low with a stop just a penny above the pre-market high. So the initial risk was about 30 cents. My target was $35.60 which matches up with support and the 10 day EMA on the daily timeframe. By mid-afternoon that target started to look too optimistic so I tightened my stop and was stopped out at $37.00.

The AAPL long was a break of the third bar high. This is another stock I was watching in pre-market. The first two bars were doji like (indecision). The third bar rallied and closed on its high so I went long on a break of the third bar high. I had to leave my desk for an extended period of time so I decided it was safe to move my stop to break-even as price approached $88.00. Big mistake. If my entry was correct and I believe it was, I should have left my stop below the low of the previous bar (third bar). That would have saved the trade. So a nice strategic, dummy entry and a real dumb, dummy stop.

Monday, November 20, 2006

NASDAQ Technical Picture - Bullish Low Volume Consolidation

Except for a very bullish semiconductor sector, the overall market felt sluggish. Low volume consolidation is bullish, but I'm starting to see some negative divergence on the lower timeframe. No economic data tomorrow.

Blogger Bugs

I've noticed a few blogger bugs of late. For example, my DayTrade Team Buzz ad has vanished with no intervention on my part. I checked my template and all of the code supporting the ad is missing. And recently, I've started having problems posting charts again. I read some horror stories about people losing their entire blogs. Hope that doesn't happen here or to any other Blogger Blogs in the trading community.

Dummy Trade of the Day - Marvell Technology Group Ltd. (Public, NASDAQ:MRVL)

Both of these gapper trade setups came from my gapper scan. MRVL gapped up and formed a NR body with a short upper and long lower shadow. The second stick was almost a bullish engulfing bar. The third stick rallied into resistance and pulled back slightly. I decided to long a break of the third bar high as I didn't feel that MRVL was going to consolidate and I was willing to risk 25 cents. I booked a 50% profit on weakness midday and held the balance into the close. When MRVL breached it rising 10 period MA in the afternoon, I was getting ready to sell. However, it immediately regained it on the next bar, so I decided to hang on.

KNOT had a bearish opening bar with a long upper shadow. It spent the better part of the morning consolidating sideways with small, tight candlesticks. Shortly after 11:00, it carved out an NR7 stick on extremely low volume. The next bar ticked up on higher volume and that was my cue to get long. The rising 10 period MA was just underfoot and added to my confidence in the entry. I took my exit on the anticipation of a hanging man reversal.


Sunday, November 19, 2006

Anatomy of a Gap Up Reversal - Laboratory Corp. of America (Public, NYSE:LH) 10.03.2006

A reader asks if LH was a good long setup following the NR7 bar identified in the chart above.

I'm going to begin, perhaps unfairly, by saying that my success rate with long entries on stocks that swoon from extremely large opening gap ups, is less than 40%. If a stock doesn't start showing signs of a reversal by 10:30-10:45, it is not going to stay on my gapper watchlist. After last week's ISIS trade (posted on the blog Monday Nov. 13th), I have pretty much decided to stay away from these types of setups. Notwithstanding that little preamble, let's analyse this setup of LH from October 3rd.

Despite the high volume pullback, LH did hold its rising 10 period MA as support on a closing basis. It also carved out a bullish engulfing pattern around noon as price started to lift from the 10 period MA after some lengthy sideways action. So far, we were looking at a potentially bullish reversal. The next move takes price up to $68.25 on higher volume. Notice that the high here fairly evenly matches the low of the second bar and creates a pivot point. This is followed by some more consolidation and a potential shallow rounded pullback before a bullish break of the pivot point. Midway, we get a NR7 bar followed by some movement upwards, but volume on the bar following the NR7 is not bullish. So if you had bought this bar, you are on notice of a possible failure when the next bar shows no continuation on lower volume.

Since my experience with these is fairly negative, I would recommend longing them only after confirmation. In this particular case, confirmation would have been a higher volume break of the pivot point. Notice how the pivot point was observed the next day as resistance.

After having invested the time to map out a trade that didn't get confirmed, you could have shorted it using the pivot point as your stop. The next support level was $67.00 giving a decent risk:reward ratio.

Thursday, November 16, 2006

Momentum Stock - Intraday Setup - ZOLL Medical Corporation (Public, NASDAQ:ZOLL)


Thanks to Misadventures for pointing this one out. At noon, there was a volume lull. The next bar moved to the top of the narrow channel on an uptick in volume. After that, momentum came back into the stock and it rallied steadily up until 3:30.

If you get into a position when the MA is too far away from price, you might get shaken out on the pullback.

Dummy Trade of the Day - Network Appliance, Inc. (Public, NASDAQ:NTAP)


I didn't have time to run any scans at work today, so all I managed was a quick scalp on NTAP as it paused for a quick consolidation midway through this rally. This is a 10 min. timeframe. Click on the chart for a larger view and you will notice how volume diminishes during the consolidation and immediately picks up as price moves forward. These are the little details to look for when trying to catch a move that's already underway.


Blogger Problems posting charts again tonight. In FireFox, my charts are cut off at the bottom and in Explorer I'm just getting blanks.

Wednesday, November 15, 2006

Technical Trade Idea - CheckFree Corporation (Public NASDAQ:CKFR)


I am adding CKFR to my watchlist here. It looks like sellers can't move price any lower. Tuesday's NR7 bar was followed by a bullish engulfing bar yesterday. I'll buy a tradable pullback if support holds, or a breakout above yesterday's high. My short-term target is $40.00.

Groundhog Day - (NYSE:CAL) and (NASDAQ:GROW)

CAL gapped up on the open due to merger mania in the airline industry. I waited for a low risk NRB before my entry. I moved my stop to breakeven once it started testing the early morning resistance (blue line). However, CAL traded in a very narrow range for an hour and then broke through for a nice orderly, afternoon rally.


GROW opened strong and carved out a WRB followed by a narrow sideways consolidation, similar to yesterday. I entered on a break of the OR high. I took my exit when I noticed the hanging man reversal pattern starting to develop.

I don't know how much higher these two can go, but both names had stronger volume today than yesterday. I'd like to see them both pull back on the open tomorrow and setup one last long entry.

Tuesday, November 14, 2006

Stock Tickr Interview with Tom C.

Don't miss Dave's interview with Tom C. from the Trader-X blog. BTW, the interview doesn't explain how Tom and X came to be collaborators. Just curious.

Momentum Stocks - Finding Low Risk, Intraday Setups - eFuture Information Technology Inc. (Public, NASDAQ:EFUT)

NYX - Friday's Action

EFUT - Today's Action

In response to a reader request, here is one way to play momentum stocks intraday. Momentum stocks usually consolidate the morning move midday and into early afternoon. Between 1:30 and 2:30 the volume declines as price comes into the rising 10 period EMA. Don't buy the first bounce off of the MA, wait until volume almost dries up and price narrows accordingly. Just when you feel the stock is barely moving, its time to place a buy order. The low of the last NRB before entry is almost always higher than the preceding NRB's low. If your entry is timed perfectly, you will feel the uptick in volume almost immediately. I usually set my stop about 5-10 cents below the 10 period EMA.

BTW, this is one of my favorite setups and I look for these after lunch on my gapper charts. My CAL trade today follows a similar pattern and risk level and my JOYG trade Friday afternoon was also comparable.

Dummy Trade of the Day - U.S. Global Investors (Public, NASDAQ:GROW)

GROW was a low risk, consolidation breakout after it had digested the opening WRB for well over an hour. The consolidation took place on lower volume and the break had a noticeable uptick. I took my exit after GROW had carved out a lower high. It doesn't look like much on this chart but it netted 1.3 points.

CAL was low risk entry following a NRB with the support of the converging MAs. Volume picked up shortly after my entry and carried price up to $ 38.60 in four consecutive bars. It formed a tweezer top reversal pattern so I moved my stop up to $38.50.

NASDAQ Technical Picture - Low Volume Extension


For now, I'm going to stop fighting the tape. It seems that we just keep going higher. Yesterday's low volume rally was led by the $SOX which seems to be waking up all of a sudden. I'm assuming that the low volume is holiday related, with people taking off on both sides of the actual day. Yesterday's SOX rally felt like a dead cat bounce, but the P&F charts for both the NASDAQ (P&F target 2540) and the SOX (P&F target 544) are very bullish, so I'll go along with that.

Monday, November 13, 2006

Dummy Trade of the Day - Continental Airlines, Inc. (Public, NYSE:CAL)

CAL gapped up again today and set up a nice long on a break of the OR high following a NRB. Long on the fourth bar. Despite two lengthy consolidation periods, there was never any reason to close the position until the end of the day as price never challenged the rising 10 period ema.

BTW, CAL traded up to $39.00 in AH, but I can't find any news on Briefing.com


HANS was a short setup after consolidation of the gap fade, but it found support at $26.00 and I lost my patience with it when it tried to rally in mid-afternoon.


ISIS was a failed breakout long at $12.5o. I was stopped out for a small loss.

Pre-Market

Canaccord Adams upgrades HANS to Buy from Hold and raises their tgt to $37 from $33 and adds the stock to their Best Ideas list saying they now have high confidence that revenue/earnings expectations can be met and that future analyst estimate revisions will be positive rather than negative.

CIBC upgrades CEPH to Outperform from Sector Perform with an $89 tgt saying they believe strong sales of Fentora and Provigil will help offset sales lost to generic Actiq. They believe 4Q and '07 top-line results that beat expectations and raised co guidance will drive near-term upside.

ISIS Pharma reports ISIS 301012 significantly reduces all atherogenic lipids when dosed as a single agent and when coadministered with satins (10.38 ) : Co announces new results from two Phase 2 clinical trials of ISIS 301012 presented at the American Heart Association Annual Scientific Sessions. In the first study reported, patients with high cholesterol on stable doses of statins were treated with ISIS 301012 for five weeks. Patients who received 300 mg/week of ISIS 301012 in this study achieved a 51% reduction in LDL-cholesterol, a 42% reduction in total cholesterol, and a 41% reduction in triglycerides beyond the levels achieved with statins alone. Isis also presented new results from an ongoing study in which patients with high cholesterol were treated for three months with 300 mg/week of ISIS 301012 as a single agent. Data from this study for dose cohorts through 200 mg/week were previously reported. In this study, increasing the dose of ISIS 301012 to 300 mg/week further reduced atherogenic lipids, with improvements in LDL-C, TC and TG of 62%, 46% and 43%, respectively.

Courtesy of Briefing.com

My note: ISIS gapping up to $14.00 in pre-market on high volume. ISIS has not seen these prices in years but looking at the monthly timeframe, there is resistance in the $15.00 area.

Under the Weather

I had planned to put together my follow-up post to "Trading Gaps Dummy Style" this weekend but a migraine got in the way. Hopefully, it will die soon so that I can get back to work.

Friday, November 10, 2006

Dummy Trade of the Day - Continental Airlines, Inc. (Public, NYSE:CAL)

CAL was an NR7 range contraction/expansion trade that I planned to take on a break of the downsloping trendline. However, the opening gap was too wide, so I waited for a NR low risk entry following the doji consolidation of the second bar. My preliminary target was $36.56 and I moved my stop to $36.49 when it appeared that we might be able to go higher. A few minutes later my stop was hit.

JOYG was a low risk entry following a lengthy consolidation. The stock rallied into the close taking out morning resistance and challenging yesterday's high. I like these types of setups and look for them between 1:00 and 2:30 in the afternoon. After a strong move in the morning and a fairly orderly pullback, the stock forms a series of very NRBs and a shallow base. It usually starts to lift on an uptick in volume and often rallies into the close.

Pre-Market - NVIDIA Corporation (Public, NASDAQ:NVDA)


CIBC notes after the close NVDA reported stellar Q3 (Oct) results of $821 mln in revs and pro forma EPS of $0.39 vs. consensus ests of $754 mln and $0.35. Firm believes the co continues to benefit from strong execution, capitalizing on the competitive opening provided by the AMD/ATI merger. Top-line upside was driven by improved mix and increased market share in NVDA's core markets of desktop, notebook and chipsets. With the hard launch of its flagship 8800 chip and Santa Rosa design wins, firm thinks NVDA remains well positioned to solidify desktop/notebook share in coming qtrs. Firm does not expect NVDA to sustain its strong position on the AMD platform, as AMD transitions ATI's chipset business to its own platform. Firm thinks NVDA could more than make up the difference on the INTC platform, though it may take some time. Firm anticipates investors will react positively to the report, despite heightened expectations heading into the call... ThinkEquity notes that NVDA is trading substantially above their Universe and faces more risks than Bulls care to admit: ASPs were down overall, die sizes are increasing, and ATI is likely to have a competitive offering in the near future. Yes, NVDA is growing faster, but firm believes this is already in the stock. Firm says NVDA EPS came in-line with Street consensus, and $0.01 above their ests. If firm keeps the patent license payments for NVDA's past usage, they get $0.35 ex-stock based compensation, not the $0.39. Firm raises thier tgt from $25 to $28. Firm believes Dell (DELL) is ramping AMD/NVDA chipsets and is now shipping consumer desktops, corporate desktops and consumer notebooks with AMD/NVDA chipsets. This is an obvious positive for Advanced Micro Devices (AMD) as well, and could begin to give DELL more of a fighting chance in the price war with Lenovo and Hewlett-Packard (HPQ)... Thomas Weisel sees multiple potential catalysts over the next six to 12 months that could drive rev meaningfully higher from current levels including 1) incremental boost from Vista rollout (not currently modeled), 2) ongoing notebook and workstation share gain opportunities, 3) expanding near-term chipset penetration, notably Intel-based solutions, 4) GeForce 8 rollout, 5) PS3 ramp, and 6) potential participation in upcoming video iPod (not currently modeled)...

Stifel downgrades NVDA to Sell from Hold following earnings. The firm says while NVIDIA turned in a very strong performance for the October quarter and they believe should continue to see share gain momentum carry over for the next several quarters, they are increasingly concerned about the potential for gross margin improvements significantly above the current guidance range. The firm believes potential for increased operational improvements is becoming more limited, and they believe risks associated with product mix shifts, increased competition from AMD in key end markets, and dilution from the proposed Portal Player acquisition could be countervailing forces that could cap gross margin improvements.

NVIDIA upgraded to Market Perform from Underperform at BMO Capital (35.29 )

Courtesy of Briefing.com
NVIDIA (NVDA $35.29 +0.69) had a massive qtr on the top line and beat on the bottom line. As a result, we thought we would highlight some of the important points from the earnings call and the implications for the market. Co noted their notebook GPU revenue grew 47%-46% Q/Q and over 100% Y/Y. Co expects their share gain to continue through the year and then accelerate as they see should designs wins based on Intel's (INTC) standard notebook platform. On a non-GAAP basis, gross margins were 42.9%. The gross margin percentage was negatively impacted by the higher growth in the lower margin businesses such as memory, mainstream, desktop GPUs and MCT. However, co notes each individual business unit continues to make progress in improving gross margins. Despite what might appear to be relatively flat margins, co thinks they are continuing to make progress in improving gross margins. While the co gave limited info on the balance sheet, they noted accounts receivable were down by 20 million and inventory was down by 5 million. On the outlook, co noted the magnitude of their rev growth may be difficult to forecast but they are comfortable with 5% growth even if memory declines. Co expects gross margins to show continued improvement. While the co may not make their 45% target by year end, co is comfortable with gross margin increase of 100 basis points to more in Q4. Implications for the market: NVDA appears to be benefiting from the confluence of market anticipation of the Vista release in 1H07 and taking advantage of the window of opportunity to take share as the AMD-ATYT integration continues to take place. Given the multiple catalysts going forward (i.e., desktop, notebook and consumer electronics), strong institutional support and NVDA being the only pure play left in the graphics space heading into the graphics intensive Vista rollout, we would expect NVDA to continue to see upwards momentum in today's trading.

NVIDIA: Hearing Bear Stearns raises target from $39 to $42; Soleil raises target from $36 to $41;/ FBR raises target from $36 to $40 (35.29 ) -Update-


Thursday, November 09, 2006

NASDAQ Technical Picture - Bull Trap?

The McClellan oscillator has carved out a series of lower highs and lower lows since mid-October and looks ready to swoon.

Last week a bear trap and now a bull trap. Get ready for some profit taking. We have negative divergence in the RSI and the ADX line has failed to confirm recent bullish momentum. We could be in for a sharp pullback in techland. Also, when a bellwether like CSCO reports great earnings, guides higher, and closes on its lows, it sends a bearish signal.