PII gapped down on Thursday October 12th on an earnings miss and downside guidance. It was trading down more than 5% in the pre-market.
A quick look at the daily timeframe showed that PII would likely open near notable support (pink segment) and the 50 day MA which had little or no slope (flat). The two pink arrows mark pivot point resistance on the long side.
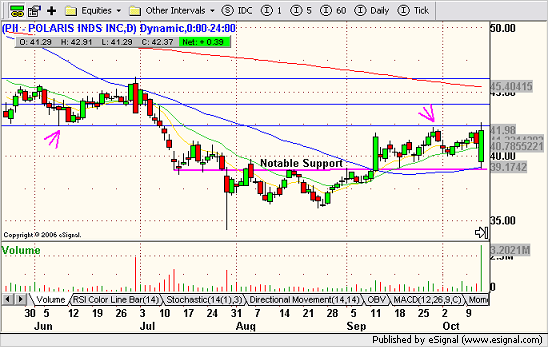 Daily timeframe
Now if we move to the 15 minute timeframe, we see that PII opens just 50 cents shy of technical support carving out a doji with a long upper shadow. The next bar is bullish and takes out the high of the OR but closes below the OR high, however it generates a higher low.
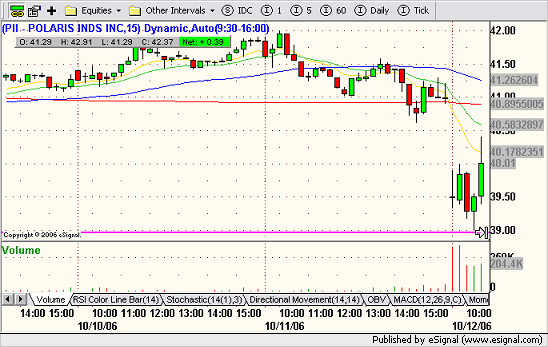
15 minute timeframe
If we flip over to the 5 minute timeframe, we see that the downsloping 10 period MA is coming down to help push price lower. The first half hour of trade has been NR basically trading between $40.00 and $39.50. At point A, where the 10:00 bar takes out the low of the 9:55 bar, we might decide to take a short position with a preliminary target of $39.00 because the risk reward ratio is very favorable. Our risk is approx. $0.25 and out reward $0.75. As price approaches point B, we would lock in 50% of our profit and hope for a tight consolidation before breaking technical support (pink segment). At point C, we are starting to have doubts because the technical bounce has legs ie. more price momentum than typically corresponds to a consolidation or pullback. Inevitably, we are expecting to get stopped out, but still hoping that the downsloping 20 MA will be observed as resistance. When that doesn't happen, we get stopped out, however, we still have a 50% profit on the trade.
Now getting back to the reader's original question, how to play PII long on a gap fill scenario. Once price has closed above $40.00, it seems clear that a gap fill is in play, so a long entry would be taken around point D, with a stop 10 cents below the 20 MA. This an aggressive play and I would not have taken it, especially with the 50 MA swooning down midway between $40 and $41.oo
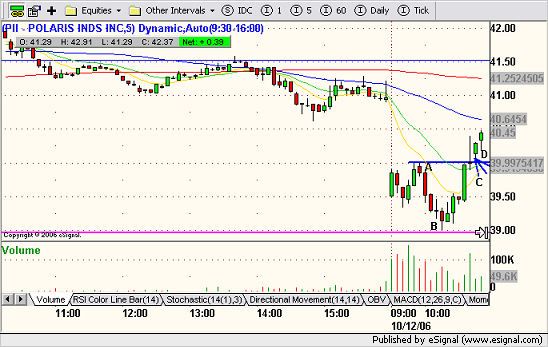 5 minute timeframe
Going back to the 15 minute view, we can manage the trade from this longer timeframe once the long is safely underway. Exit 50% on the gap fill and set a tight stop as price approaches the previous day's afternoon high. The uppermost blue line marks pivot point resistance from the daily view, so if you are still in the trade beyond the gap fill, this is an ideal exit target.
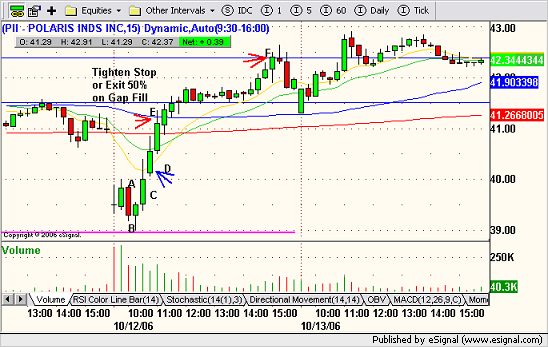 15 minute timeframe
 Technical bounces can be very powerful trading opportunities, however, given the fundamental scenario of missed earnings and lowered guidance in the case of PII, it is unlikely that most traders could have predicted the ultimate outcome. In analysing this trade setup, I tried to put myself in the trade at the time it happened, without the benefit of hindsight. As indicated above, it is very unlikely that I would have pursued the long side of the trade after being stopped out on the second half of my original short. Also notice that there were no real low risk entry opportunities on the 15 minute timeframe leading into the gap fill.
2 comments:
Hi Jamie,
Thanks for taking time to do out this detailed analysis of PII trade.
You're welcome
Post a Comment