Showing posts with label double_top. Show all posts

Thursday, January 06, 2011

Technical Picture - Markets Mixed Ahead of Jobs Data

Marginally disappointing initial claims figures gave the bears the edge in pre-market. A 62% retracement of the early slide was ambushed and the S&P emini futures extended a full measured move in 30 minutes of fast selling. After the midday chop, no follow through occurred as participants were cautious ahead of tomorrow's jobs data.

On the 60 minute chart of the SPY we see a double topping pattern taking shape. If the pattern breaks down, we could see some fast selling. On the daily (not depicted) we have two red hanging men, which, if confirmed, could be very bearish short-term.


$USD strength continued for the third consecutive session as price broke out of a month long bullish flag pattern. Energy, precious metals and commodities (excluding Ags) saw some profit taking.

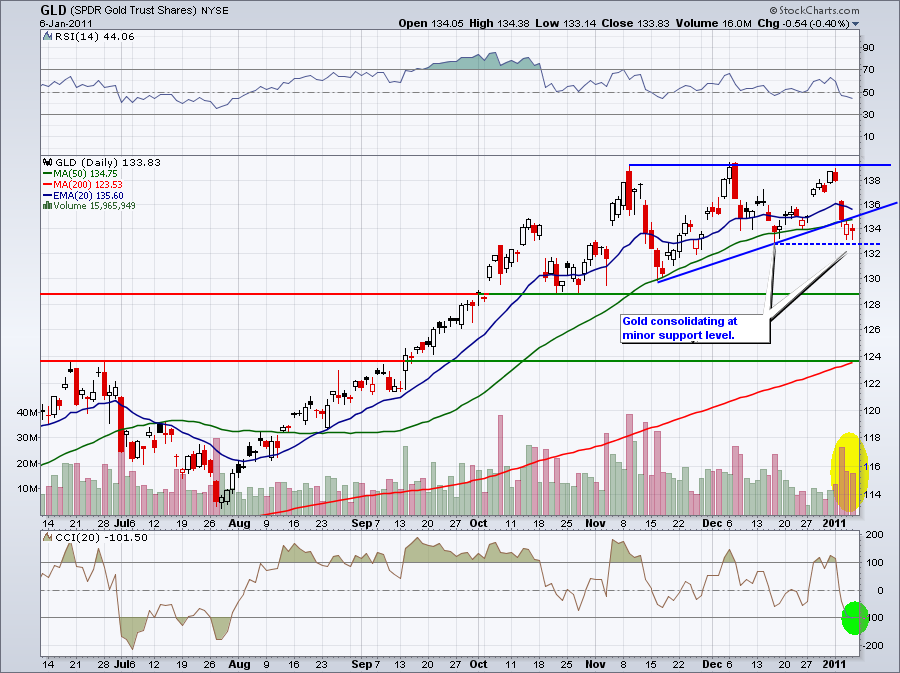
Watching KOL closely for a possible bearish island reversal.

Not many good stocks to day trade today on my radar. Took a long entry in VRX as price pulled back into the BB and found support from the rising 5 period EMA on the 15 min. timeframe. Price/volume contracted (NR7) ahead of expansion, but the expansion was somewhat slow.


Monday, January 03, 2011

Technical Picture - Broad Based Gains to Start the New Year

Markets gapped up and broad based accumulation ensued to start the New Year. Both the Nasdaq and the S&P rallied beyond the top of the recent, tight trading channels. After breaching the channels, prices slowly reversed, forming rounded tops intraday. Rounded tops are bearish, implying too much supply, not enough demand at these prices.

I wouldn't be surprised to see a double top develop. Watch the 5 day MA intraday, for support. If a double top forms, we could see some fast selling.

The $USD bounced back today as we discussed last night. That accounts for the weakness in precious metals. Although the greenback failed to hold most of its gains into the close, it stopped the bleeding from last week and manged to close slightly above its 50 SMA.


NQ emini futures trade. Long on break of bull flag. Exit after higher prices fail to print red price bars, indicating a loss of momentum. Wish I had shorted, but was not expecting such a big afternoon slide, given the early momentum.


Early strength was faded, as many commodity names had moved too far, too fast. By EOD we had a lot of bearish shooting stars and doji shooting stars

MIPS broke out and held most of its gains into the close.

Make money in affiliate marketing Click Here!

Thursday, September 23, 2010

Technical Picture - Diverging Markets

Futures sold off overnight on disappointing data out of Europe. Initial claims weren't good enough to turn things around so we gapped down on the open. Tech buyers immediately stepped in, but the broader markets needed a bit of a nudge in the form of better than expected existing home sales and leading indicators.

As you can see from the 15 minute charts of the Q's and SPY below, we have diverging markets. Tech is still holding support above the 5 day MA and the SPY barely tasted it on the gap fill. The Q's took out the PDH and tested Tuesday's post FOMC highs, but the SPY just managed to fill the gap, edging into the lower range of yesterday's action.

The two markets don't have to trade in lock step, but at some point, they have to confirm each other. This is an intraday tell and non confirmation leads to reversals in the price action. So, it was no surprise when the markets swooned into the close.

One of the reasons we've diverged so much is quarter-end window dressing. Institutions are busy loading up on sexy tech names like BIDU, AMZN and AAPL to make it look like they got it right, and at the same time, they're unloading the weaker sector names like GS.

After three consecutive lower closes, I would expect some stabilization in the S&P. Hopefully, we can manage to hold the 200 SMA on a closing basis.


GS has broken through several support areas and we have two bearish gaps to deal with. If it can't stabilize here, watch out below.

Trade of the day - AAPL - Break of ORH after NRIB. Place fibs over previous day's range to set Fib. targets. AAPL is trading blue sky (all time highs) so it can run. When the Q's tested Tuesday's high, it was time to fold.

GOOG is flagging nicely.

Wednesday, September 08, 2010

Technical Picture - Consolidation

Stocks opened on a firmer note following some favorable overseas debt auctions offsetting yesterday's concerns. Leading stocks paced higher topping out around midday when the DOW failed to confirm higher highs in the Comp and S&P. Stocks pulled in slightly ahead of the Beige book which was a non-event. Choppiness ensued into the close.

As we can see from the S&P chart above, we are flagging at the cusp of the down trend line in the upper range of last week's flag pole. However, many momo stocks such as AAPL (chart below) and GS are testing resistance from the August highs. Also, I'm seeing a number of long upper shadows on the dailies of my WL.


The CREE short setup was highlighted by Steve Place on Stocktwits TV yesterday. Short on break of ORL. Price closed at the round number $50.00. Other names breaking down with volume today include V and MA.

FFIV tested resistance from last two sessions. Placed my Fibs from the low of the outside day to the upper base. Missed my exit when price suddenly reversed just shy of the target.

MTL was a HCPG pick from last night. I ignored the false BOs and placed my fibs on inside support/resistance. Worked out perfectly for a full extension.

NTAP broke resistance and rallied two points. Now it's really extended. We have a mini double top on the 15 minute timeframe. I'd like to see a retest of the base at $45.00. Could setup up a fast move lower on a trendline break.

Also watching gold names as they retrace back to their trendlines.

Thursday, August 19, 2010

Technical Picture - Unexpected Rise in Jobless Claims Drags Markets Back Down

An unexpected rise in Initial Claims (500k vs. consensus 475k), followed by a significantly weaker Philly Fed report (-7.7 vs. consensus +7.5) sent markets lower into midday with only a minor attempt to rally off the lows in the afternoon.

As you can see from the 15 minute chart below, the SPY formed a double top over the previous two sessions. Price gapped lower on the weak jobs data, retested the broken trendline on the opening range and was rejected. The Fibonacci lines are placed from high to low of bearish double top chart pattern in anticipation of a full measured move (100%). Price barely paused at the gap fill before resuming the move lower and attaining the target. Exit on weakness, as price approaches the target, don't wait for an exact tag.

As noted on the daily chart above, if this week's lows don't hold as support, we could target the 62% retrace of the July/August rally (ambush zone).

When price tested the morning lows on weak volume, it was an opportunity to get long. I placed my fibs from peak to trough of the last leg down in order to monitor the ambush zone as a possible reversal. Initially, price clears the 62% retracement on a closing basis, but immediately reverses, signaling the end of the move. The inability of the market to rally beyond the ambush zone leaves the door open for further weakness. Tomorrow is OPEX and things could get choppy after the first hour.

ABX was a great long yesterday, but today it carved out a tweezer top reversal at the ORH, setting up a short trade back to the ambush zone/trendline support. Since price opened within the previous day's range, place Fibs from PDL to PDH. Notice how yesterday's bullish base (support/congestion zone) lines up perfectly with the 62% Fib. retracement.


SNDK breaches its trendline on the open, tries to recover and fails. This looks like a late entry, but I didn't want to short above the 5 day support.


Euro vs. $USD - looks like a bear flag developing on the Euro and a bull flag on the greenback. If the Euro falls down, expect Gold to retest highs and the S&P to retest low end of trading range.