Showing posts with label Gap_Fill. Show all posts

Tuesday, May 10, 2011

Tecnical Picture - Bounce Extends

The market has retraced 62% of last week's slide on lighter volume. As depicted on the the 5 min. chart of e-mini futures below. Last Friday's jobs report gave us a wide gap, but formed a bearish rising wedge which eventually led to a complete gap fill. Monday's action was inside, and today we were finally able to extend beyond Friday's high.


SLV has filled the bearish gap more or less, but the bounce has been lame in terms of time and volume. It took three sessions to retrace one day's losses. Very choppy intraday action - not my cup of tea.

USO has retraced 38% of its slide, but needs to push up to 62% in order to fill bearish gap.

$USD is consolidating after breaching downsloping trendline.

Most of my morning trades were scratches but the afternoon trades turned things around. I have been keeping an eye on RIMM's decent. Today, it breached $44.00 for a minute or two and then snapped back - head fakes usually lead to good trades in the opposite direction.

RIMM is technically oversold (daily RSI below 30) and was a good candidate for an oversold bounce (short squeeze).

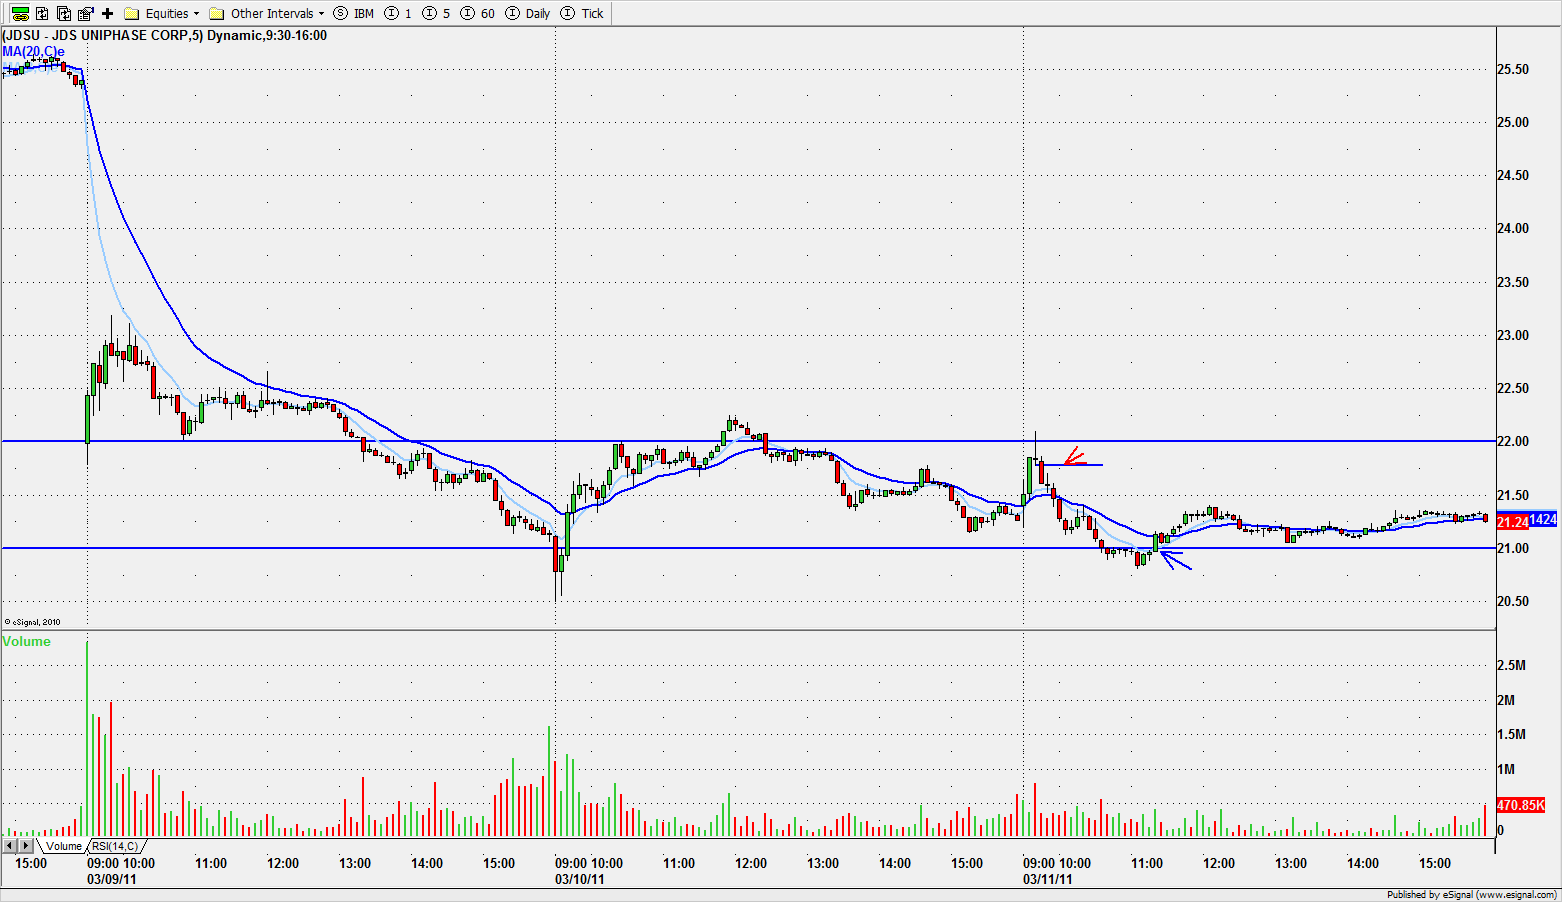
Enter long on break of NR7 following head fake. See the volume spike as price takes out the obvious resistance levels (blue lines). This is where the stops get triggered and the squeezes occur. Keep on WL for follow through.

CTSH looks well positioned for an attempt at a gap fill following last week's earnings gap.

Tuesday, May 03, 2011

Technical Picture - Correction In Play

After breaking out of a bearish rising wedge, the SPY corrected to the first minor support level and bounced in the last hour to trim today's decline. The Nasdaq corrected more sharply on higher volume resulting in a distribution day. Most technicians expect a retest of SPX 1340 (former resistance) to come into play.


The SMH retested resistance and is now pulling back on light volume which is constructive. Bullish gap support might be tested.


Th parabolic SAR sell signal for silver ishares triggered yesterday as depicted on the chart above. High volume selling over last two sessions.


The beaten down $USD is forming a tiny base. This could lead to an oversold technical bounce and move back towards the downsloping trendline.

Today's Trades

When I logged into my broker account this morning, there was a bulletin advising of an increase in margin requirements for silver derivatives. This was a good clue that SLV could be under pressure again today.


CTSH was a failed BO yesterday, and today's gap down and breach of support, set up a good shorting opp.

The best part of the CTSH trade was the reversal long after price formed a perfect, low risk handle on the 1 minute chart below.

At the EOD price broke back above resistance. I'll be watching tomorrow to see if CTSH forms a bullish inverse H&S bottom.

ARMH, another failed BO from yesterday, set up a short on break of well defined support. Took a partial at gap support, but eventually it failed. Covered balance as price approached complete gap fill. Not much of a bounce after such a big move.

Friday, March 18, 2011

Technical Picture - Inside Day on Lower Volume

Index futures rallied overnight on positive news regarding Japanese nuclear situation, however the Asian and Europeon markets still closed red. So when the U.S. markets gapped up on the open I was a concerned about chasing longs. The broader markets outperformed on strength in commodities. Tech rose 0.7% and small caps just minor gains.

I still have 1/4 swing positions long in TCK and POT which I will sell tomorrow. As we can see from the copper chart below, the technical bounce to retest the broken trendline is almost complete.

After hours, the G7 announced that they had agreed to intervene with Japan to suppress the yen causing the currency to correct and the Nikkei to pop along with S&P futures.


SMH is in the support zone, but buyers aren't enthusiastic.


Couldn't resist one last trade in SU as depicted above. I exit as soon as the daily gap was filled.

EXC gapped and fell back down to retest yesterday's lows. It based sideways for a long time and I decided to try a low risk long after price had regained the 5 period EMA.

GES gapped down on earnings and ripped lower. When selling subsided, I took a low risk long hoping for a retracement back to resistance (blue line). There was no momentum on the retrace so exit as price approached whole $ level. Price backed off immediately and bears took back control. Notice the topping pattern on the 1 minute chart below, sets up a nice short into the close.

Optical stocks FNSR, OPLK, and OCLR were crushed today. JDSU is bear flagging, and I suspect if the sector continues to sell off, JDSU could fill the gap from $20.00 to $18.00. On the other hand, given today's blood, we might head fake lower and bounce. I'm leaning towards the latter for tomorrow, but won't be surprised if the stock sells off on the next market leg down.

Sunday, March 13, 2011

Technical Picture - Markets Pare Back Losses on Softer Volume

On the wide range view of the daily $SPX chart above, we see that price is testing the summer 2008 highs that formed a bear flag before the big plunge into darkness. This could serve as a support area however, we've yet to see any conviction on the part of buyers since the correction started. Major support levels on the $SPX (blue lines) 1275, 1260, 1220, and 1175.

Friday's bounce was no different, as we bounced on below average volume on the $SPX. The SPY chart below shows above average volume on the gap support bounce, however, still far less than on distribution days.


I'll be interested in semis again, when test the support zone. The current sell-off has a lot of conviction, and I don't want to get in the way of angry bears. The handle that formed in the support zone looks solid as to time and price coiling, so I suspect we could get a good bounce once it comes into play.

MOO gapped into the support zone and bounced. No position yet, lacks volume.

Oil printing a series of dojis as it pulls back. The doji signifies indecision. The Japan earthquake/tsunami will see lower demand from that country and the Saudi protest that wasn't = another doji.

CNQ bounced from its 50 DMA and trendline support, but here again, the low volume signals a lack of conviction on the part of buyers.

Copper looks good here. I expect a rally back up to the broken trendline. Looking at FCX, SCCO and TCK.


SU was a HCPG pick for Friday, and it played out as expected. Decided not to hold for a swing based on volume, however, SU carved out a bullish engulfing on the daily. Tomorrow, I'll look for a retracement zone trade, keying off of Friday's WRB.

Traded the ranges on low priced optical names CIEN and JDSU.

I also like the ARMH range below the gap and the potential for a gap fill.

SBUX was a failed trade on Friday, but I still think this name looks well positioned for gap fill.


Thursday, February 10, 2011

Technical Picture - DOW Ends Win Streak

The markets gapped down on weak earnings (CSCO), ignoring the better than consensus initial claims (383 vs. 410). As we can see from the S&P Emini futures chart above, we filled Monday's bullish gap and reversed back up to fill today's opening gap. BTW, a must read in the morning for a good take on the market is Gtotoy. His outlook this morning was spot on.

The rest of the session was a chop fest as various news items were digested - AAPL disappointing sales through VZ, and the mixed messages from Egypt. As the Egypt story unfolds, it will impact futures and the markets.

The DOW ended its eight day win streak, and the other major markets ended the session just above the unchanged.

The $USD looks poised for more upside.

GLD has filled the bearish gap and now looks like it is forming a bearish wedge. If the situation in Egypt worsens, gold could be in play. There are two factors at play with gold, safe haven in troubled times, and higher interest rates which dampen gold luster. GLD gapped lower on the open because of the good claims data, which in turn led to higher interest rates and lower bond prices. I still think GLD has to go and test the 200 DMA before we get a tradable bounce.

Today's trades were the same usual suspects as yesterday. JDSU, FNSR, and AGU tested short-term range supports on the open and bounced. JDSU sold off in the afternoon and probably needs a rest.


RL is consolidating the earnings gap. I'd like to buy it if it retests short-term range support at $124.00 and bounces.

CELL and TUP are bull flagging. TUP printed NR7 today, so we could get expansion tomorrow. Also, don't forget SWK which is still flagging.


These are not recommendations to buy, sell, hold or sell short. Everyone needs to think for themselves when it comes to trading their own accounts. First, it is the only way to really learn, and secondly,you are the only one responsible for your trading decisions. Think of these charts as food for further analysis. Before making a trade, it is important to have a plan. Plan the trade and trade the plan. The plan includes setting a trigger level, a target area and a stop-loss level. It is also important to plan for three possible price movements: advance, decline or sideways. Have a plan for all three scenarios before making the trade. Consider possible holding times. And finally, look at overall market conditions and sector/industry performance.

Good Trading!

Thursday, February 03, 2011

Technical Picture - Minor Gains Ahead of Jobs Data

Both the S&P and DOW have made new recovery highs since last Friday's sell-off. However, the COMPQ and RUT have yet to confirm. If the markets rally on tomorrow's jobs data, that would be ideal for confirmation. Without confirmation, it's hard to get overly bullish at these lofty levels.

GLD set up a nice short squeeze today as prices formed a solid setup out of a wide base. Looking for a gap fill as depicted below.

Note the small handle that forms at the baseline before price squeezes higher.


USD - Oversold technical bounce on test of the weekly trendline.


AMZN - bearish flag

UA - bullish flag

NR7 (price/volume contraction ahead of expansion) daily focus list APOL, FNSR, HOG, VRX

Earnings Gaps - Gap down - CSTR, LVS, PWER Gap Up - JDSU

These are not recommendations to buy, sell, hold or sell short. Everyone needs to think for themselves when it comes to trading their own accounts. First, it is the only way to really learn, and secondly,you are the only one responsible for your trading decisions. Think of these charts as food for further analysis. Before making a trade, it is important to have a plan. Plan the trade and trade the plan. The plan includes setting a trigger level, a target area and a stop-loss level. It is also important to plan for three possible price movements: advance, decline or sideways. Have a plan for all three scenarios BEFORE making the trade. Consider possible holding times. And finally, look at overall market conditions and sector/industry performance.

Good Trading!