 On the wide range view of the daily $SPX chart above, we see that price is testing the summer 2008 highs that formed a bear flag before the big plunge into darkness. This could serve as a support area however, we've yet to see any conviction on the part of buyers since the correction started. Major support levels on the $SPX (blue lines) 1275, 1260, 1220, and 1175.
 Friday's bounce was no different, as we bounced on below average volume on the $SPX. The SPY chart below shows above average volume on the gap support bounce, however, still far less than on distribution days.
 I'll be interested in semis again, when test the support zone. The current sell-off has a lot of conviction, and I don't want to get in the way of angry bears. The handle that formed in the support zone looks solid as to time and price coiling, so I suspect we could get a good bounce once it comes into play.
 MOO gapped into the support zone and bounced. No position yet, lacks volume.
 Oil printing a series of dojis as it pulls back. The doji signifies indecision. The Japan earthquake/tsunami will see lower demand from that country and the Saudi protest that wasn't = another doji.
 CNQ bounced from its 50 DMA and trendline support, but here again, the low volume signals a lack of conviction on the part of buyers.
 Copper looks good here. I expect a rally back up to the broken trendline. Looking at FCX, SCCO and TCK.
 SU was a HCPG pick for Friday, and it played out as expected. Decided not to hold for a swing based on volume, however, SU carved out a bullish engulfing on the daily. Tomorrow, I'll look for a retracement zone trade, keying off of Friday's WRB.
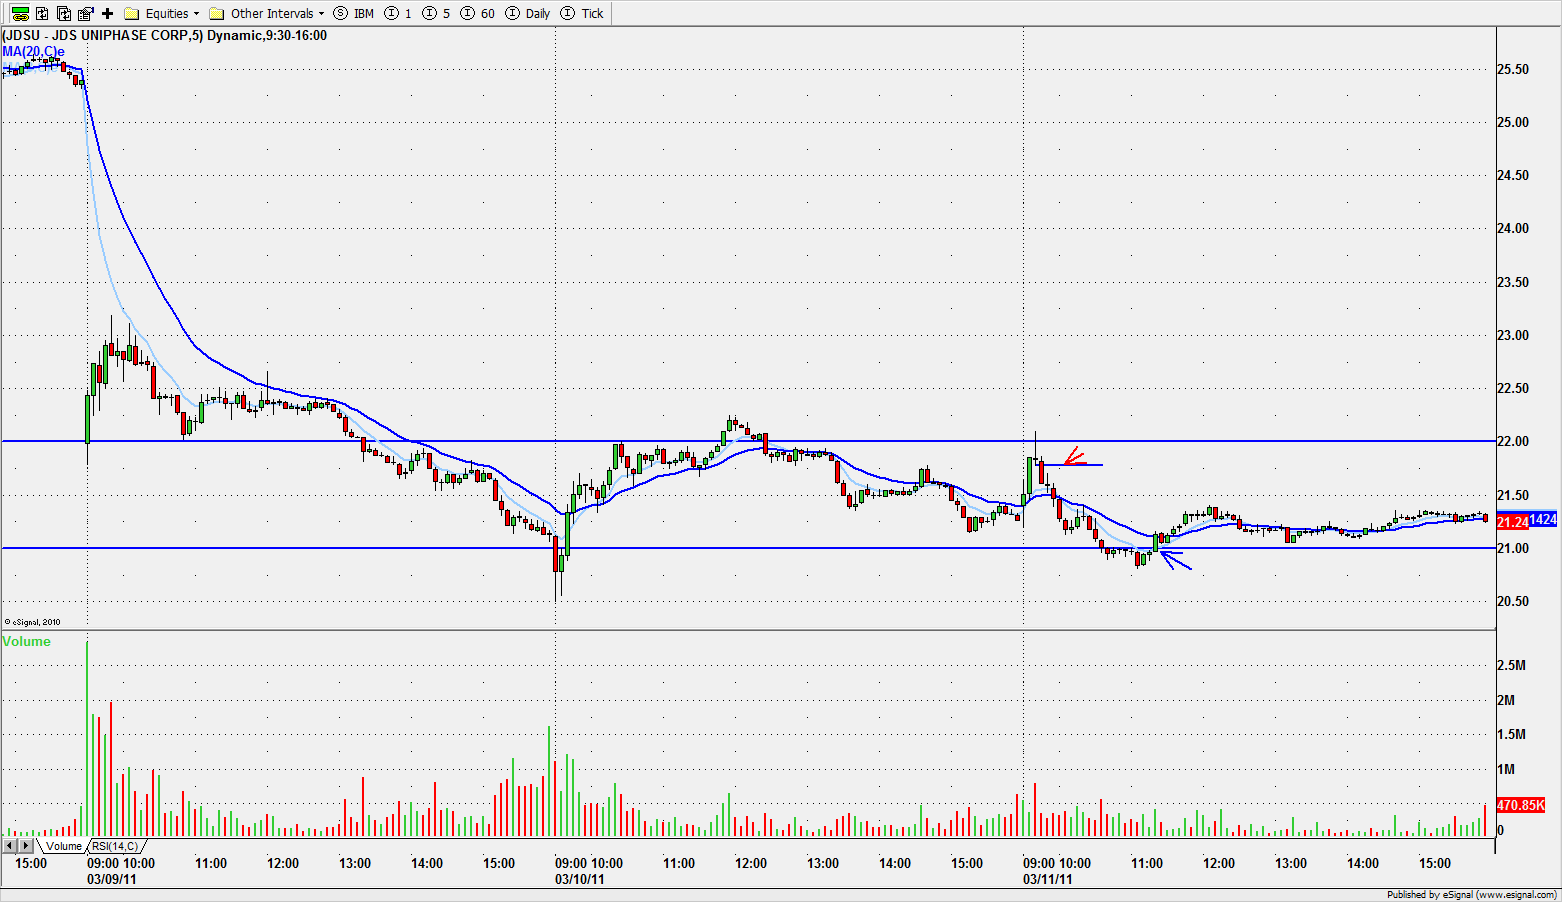 Traded the ranges on low priced optical names CIEN and JDSU.
 I also like the ARMH range below the gap and the potential for a gap fill.
 SBUX was a failed trade on Friday, but I still think this name looks well positioned for gap fill.
No comments:
Post a Comment