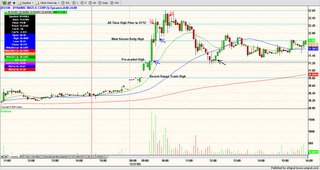
 Click on Chart for larger view.
 Blue arrows represent buy orders, red arrows represent sell orders and the black arrow represents a missed buy order.
BOOM was flagged in the pre-market as a possible momentum trade.
How and Why was the trade executed?
Boom was trading up in the pre-market. A review of the daily chart showed that if the stock gapped higher, it could make a run for the recent highs set in early and mid December. These two highs were marked on the chart (blue lines) as targets.
Minutes before the open a buy stop order was placed ($31.30) 5 cents above the pre-market high. As the trade got underway, a stop was placed 5 cents below the 10 period EMA on the 5 minute chart. The stop was moved up as the EMA moved up.
The stock consolidated briefly at the first target marked by the most recent daily high and proceeded to make a run for the all time high. The entire position was sold when the this second target was attained ($32.20) because the market as whole (NASDAQ) felt weak at this point.
As the price moved back towards the first target in an orderly fashion, a buy order was placed at $31.80. As this second trade got underway, a tight stop was placed in order to avoid too much give back from the first trade. The trade was eventually stopped out at $32.50.
After retracing all of the morning's open market gains, the stock could have been repurchased in the area marked by the black arrow for a 50% retracement of the morning play.
The first trade netted 0.90 (before commissions) and the second trade netted 0.70.
It is important to determine and flag the target areas before the trade is executed. Always expect some consolidation when price moves into the target areas. If the price activity becomes sloppy in the consolidation area, tighten the stop in order to avoid giving too much profit back.
No comments:
Post a Comment