 Click on charts for larger views.
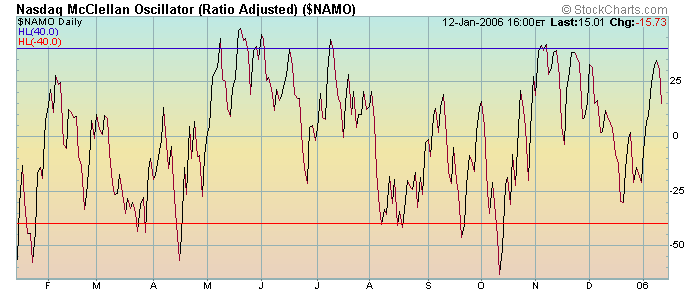
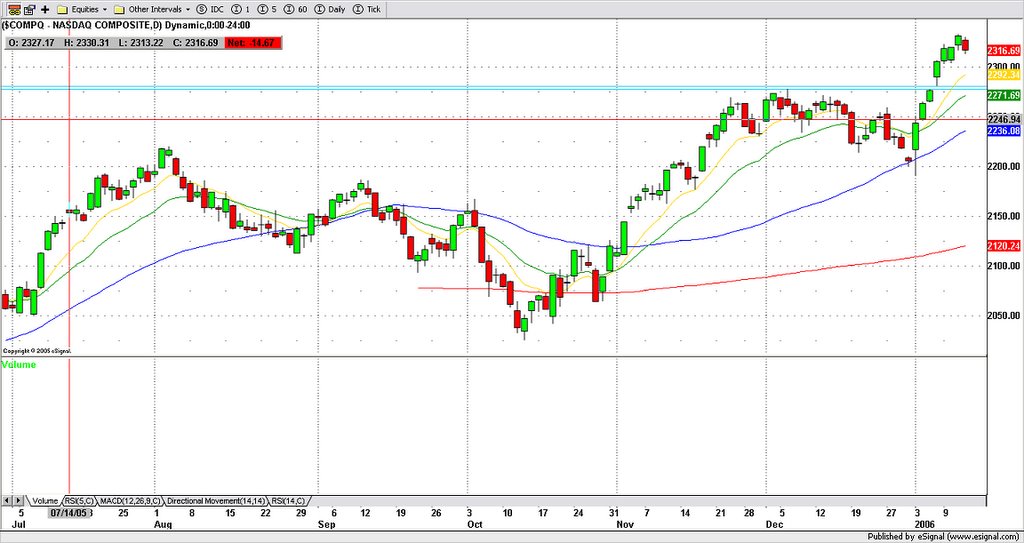
The first chart shows that the McClellan Oscillator is headed lower from its recent highs. The Nasdaq daily chart shows that today's action is clearly bearish with today's close well below yesterday's open. (We didn't get much a bounce from this afternoon's free fall. ) The green line approximates intial support in the 2306 area which is about 10 points from where we are now. The double blue lines at 2280 show a level of notable gap support. My trading strategy during the pullback will be cautious and I will concentrate more on story stocks, gap plays, and momentum stocks rather than best of breed.
No comments:
Post a Comment