Click on chart for larger view.
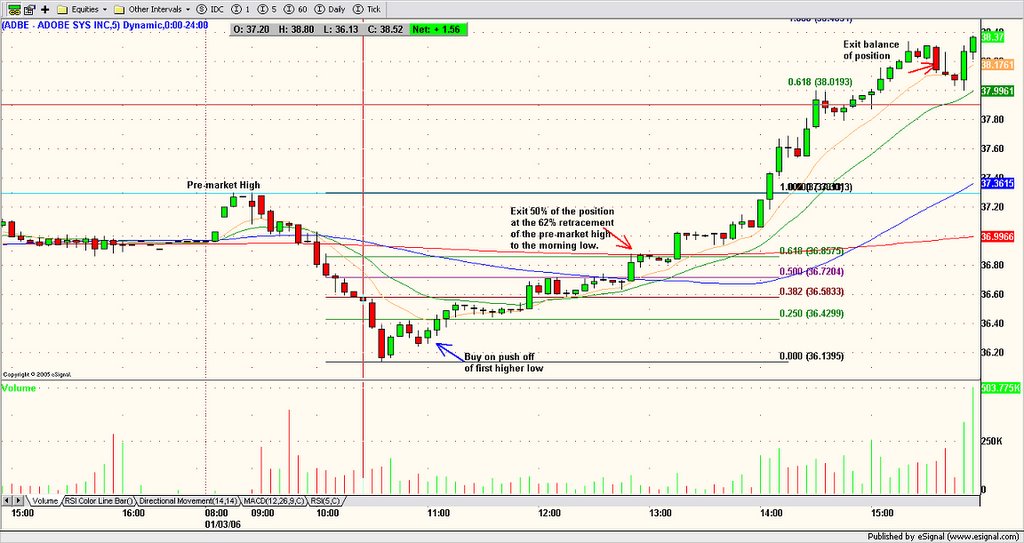
As noted in the Pre-market section here this morning, ADBE was trading up and looked good to take out recent resistance in the area of $37.30. However, on the open ADBE fell over and proceeded south for the first full hour of trade. Just as things started looking pretty bleak, the stock halted and slowly started moving back up. A position was taken on the first higher low on the 5 min. chart with a target of 62-100% retracement of the pre-market high. 50% of the position was exited when the 62% retracement was achieved. Just after the FOMC minutes were released, the market took off and so did ADBE. The Fibonacci extension tool was used to determine a secondary target. At the 62% extension of the pre-market high, price stalled, but it soon became clear the rally would continue so I stayed in the position until the second red arrow. After a shallow pullback, ADBE continued its ascent into the close. Since the stock closed on its highs, it will be on my radar again tomorrow.
Why was the trade taken?
After an orderly pullback (very little overlap of the candle real bodies), a piercing reversal candle formed off of the low. The trade was executed just off of the first higher low, another encouraging signal.
What was the target?
Fibonacci retracement. The eventual target was extended during the course of the trade as new information (reaction to FOMC minutes) cast a more bullish tone to the trade.
No comments:
Post a Comment