AMD
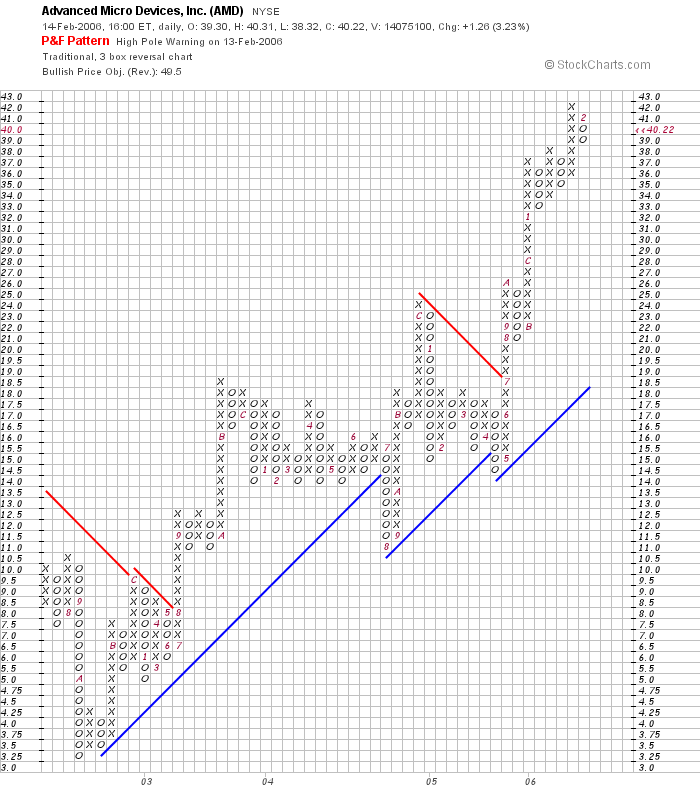
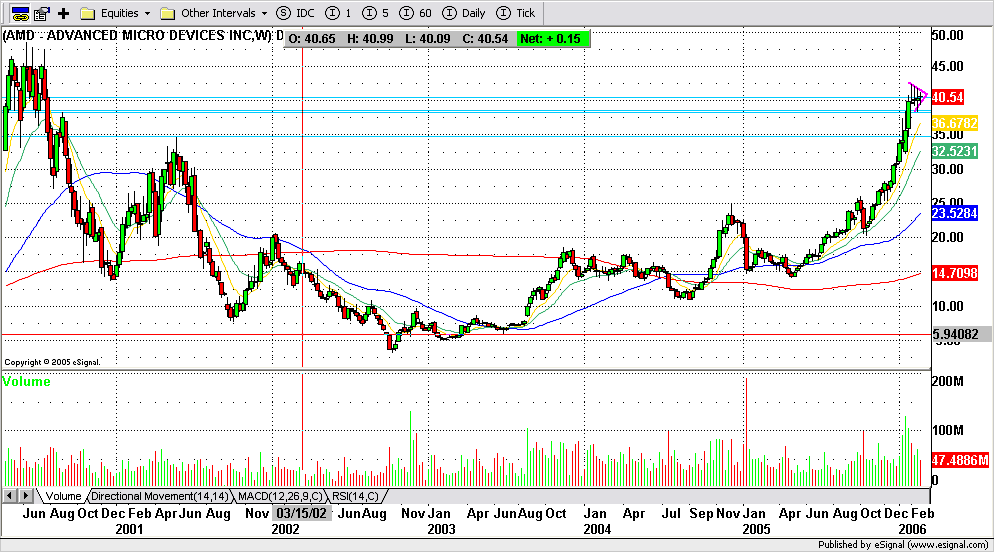 AMD is in the process of consolidating its recent gains on lower volume. It's also forming a cup which has been developing over several years. On a break of its pennant formation and on a measured move basis it should be able to retest its all time highs in the near term. The target price on the P&F chart is $49.50. We could see new money coming into the stock this week as institutional buyers traditionally put their money to work at the beginning of the month.
INTC
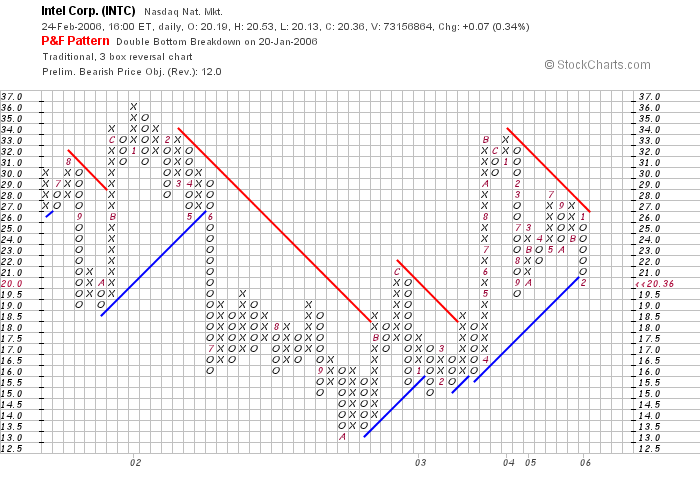
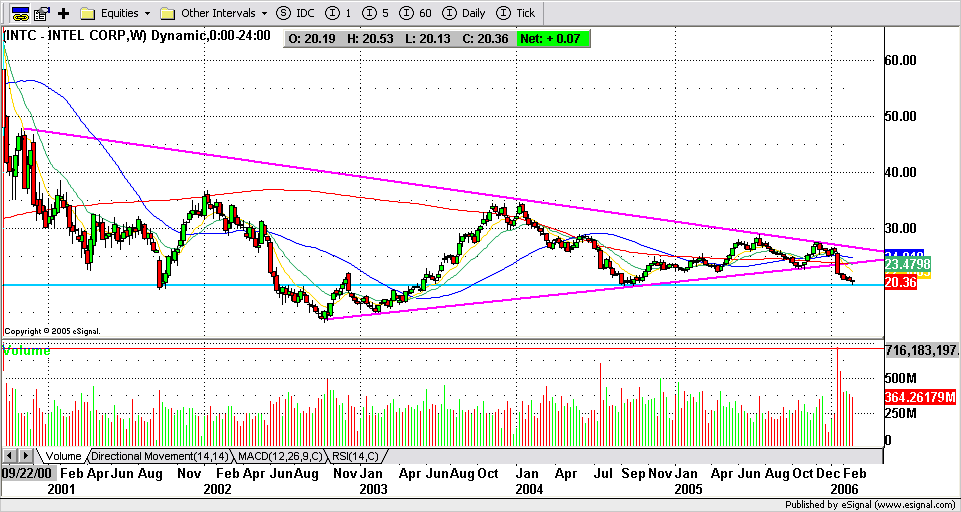
INTC is sitting on notable support and should get a lift in the short-term, however, its troubles are far from over and the technicals indicate that it has much further to fall. The weekly chart above shows that the current pattern has been building for a very long time. The technical break took place on extremely high volume which is very bearish. The P&F chart clearly shows the break in the triangle pattern and has a preliminary bearish price target of $12.00.
No comments:
Post a Comment