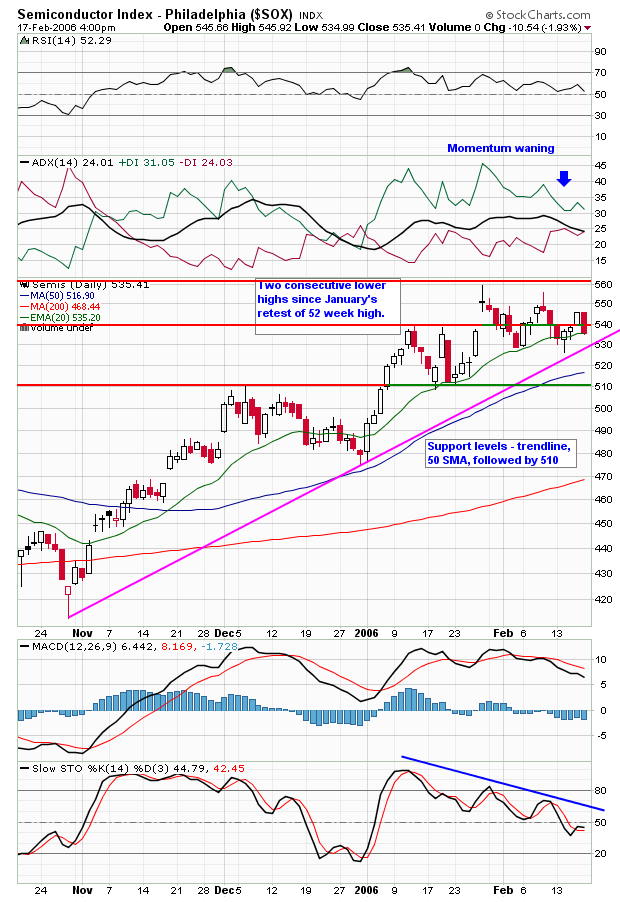
 After testing its 52 week high in late January, the SOX began a period of consolidation. It has since carved out two consecutive lower highs, and after Friday's bearish action, it looks poised to settle back into a slightly lower support area. The next three support areas are the trendline, 50 day SMA, followed by 510.
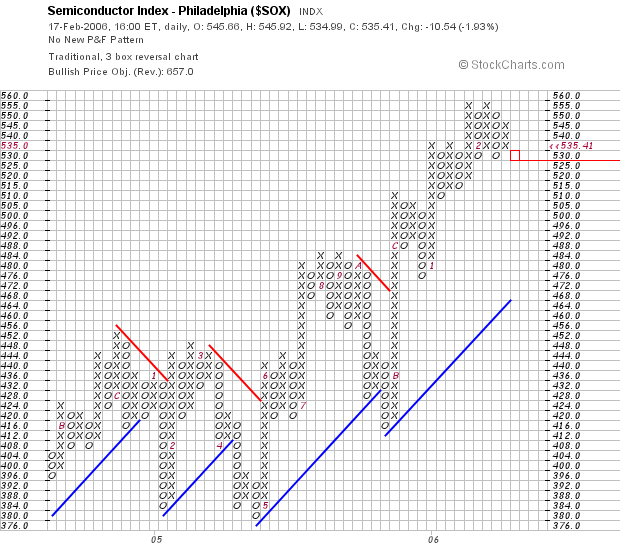
The P&F chart is still pointing to a 657 bullish price objective at least until price falls below 530.
Within the SOX there are pockets of strength as well as sub-sectors of weakness. I will review some specific names and charts in my next post this evening.
No comments:
Post a Comment