 Click on chart for larger view.
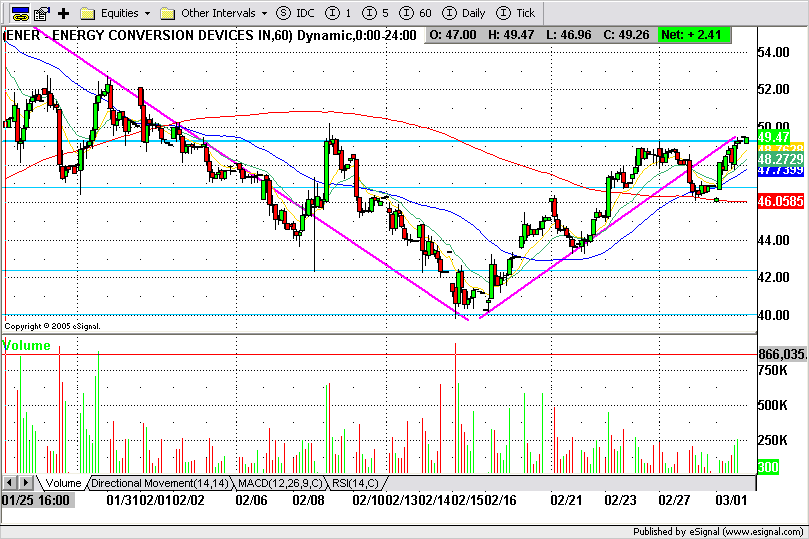
This is a 60 minute chart of ENER. Yesterday it broke its trendline and fell into the support of its 50 and 200 period MAs on a bullish MA crossover. Today it rejoined its trendline from the opposite side. This is usually a short setup, but if we look closely, it also appears to have formed a bullish cup and handle pattern. If its a true C&H pattern we will look for a high volume break. Resistance is at $52.00, support is in the area of $46.00 - 46.75.
No comments:
Post a Comment