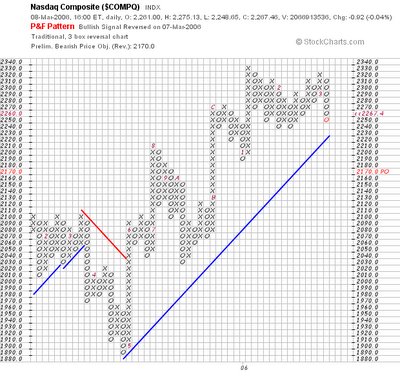
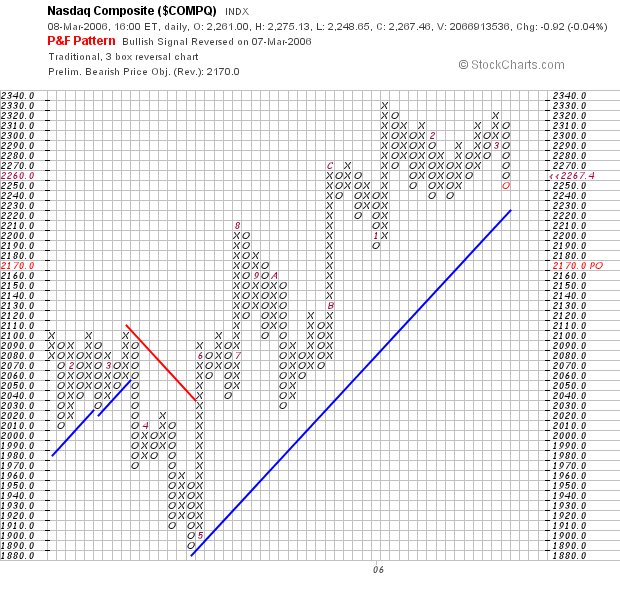
I have posted the P&F chart to show that the target has changed from 2190 yesterday to 2170 today.
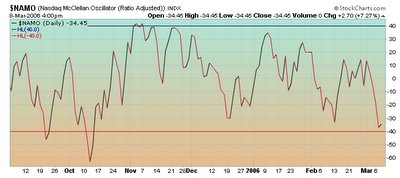
The McClellan oscilliator has a slight uptick to it which may be indicative of a reversal.
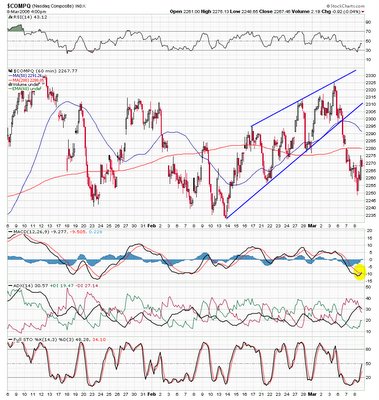
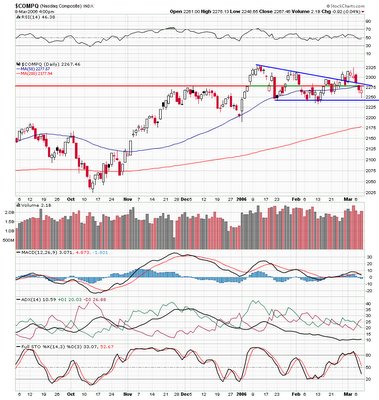
After gapping lower some 10 points on the open, the Nasdaq quickly filled the gap and then went lower for most of the morning. After briefly touching 2249, a rally ensued which brought us back to the unchanged line. All of this took place on slightly higher volume than yesterday and at the end of the day we had carved out a a narrow range starlike candle with a long lower shadow and short upper shadow (not quite a hammer). The 60 minute chart has a bullish MACD turn to it and we are still very oversold, so it looks more bullish for tomorrow, notwithstanding any news upsets. The SOX is oversold and looks ready to reverse. Not surprisingly and as discussed here last night, GHA broke its trendline on a closing basis. The Biotech and networking sectors tested their breakout points and rallyed back up. These are still the strongest sectors going forward. The internet sector almost touched its 200 day MA and formed a hammer like candle. The top three names on the Nasdaq today were
BIIB, JDSU, and
QCOM, the last of which was highlighted in my networking post last night as very bullish.
 I have posted the P&F chart to show that the target has changed from 2190 yesterday to 2170 today.
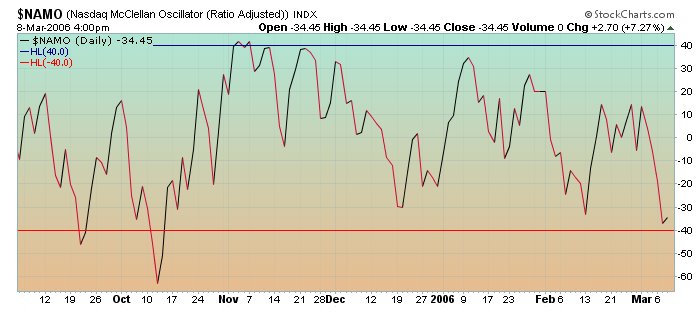 The McClellan oscilliator has a slight uptick to it which may be indicative of a reversal.
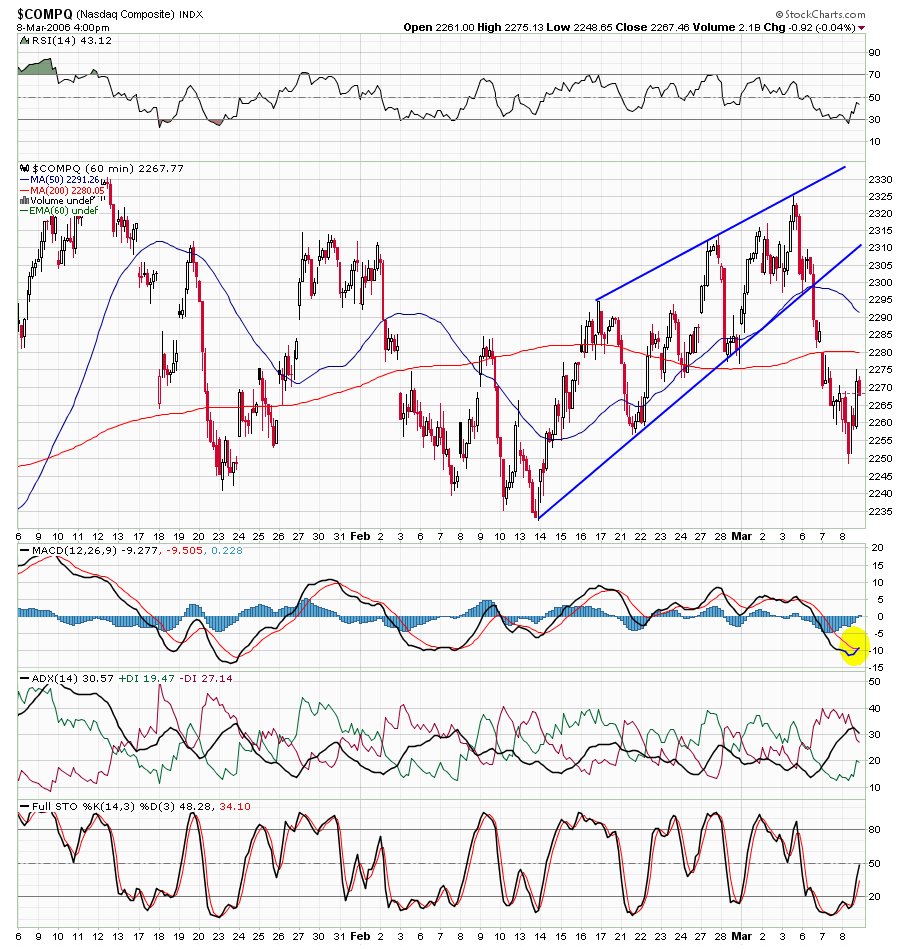
 After gapping lower some 10 points on the open, the Nasdaq quickly filled the gap and then went lower for most of the morning. After briefly touching 2249, a rally ensued which brought us back to the unchanged line. All of this took place on slightly higher volume than yesterday and at the end of the day we had carved out a a narrow range starlike candle with a long lower shadow and short upper shadow (not quite a hammer). The 60 minute chart has a bullish MACD turn to it and we are still very oversold, so it looks more bullish for tomorrow, notwithstanding any news upsets. The SOX is oversold and looks ready to reverse. Not surprisingly and as discussed here last night, GHA broke its trendline on a closing basis. The Biotech and networking sectors tested their breakout points and rallyed back up. These are still the strongest sectors going forward. The internet sector almost touched its 200 day MA and formed a hammer like candle. The top three names on the Nasdaq today were BIIB, JDSU, and QCOM, the last of which was highlighted in my networking post last night as very bullish.
No comments:
Post a Comment