
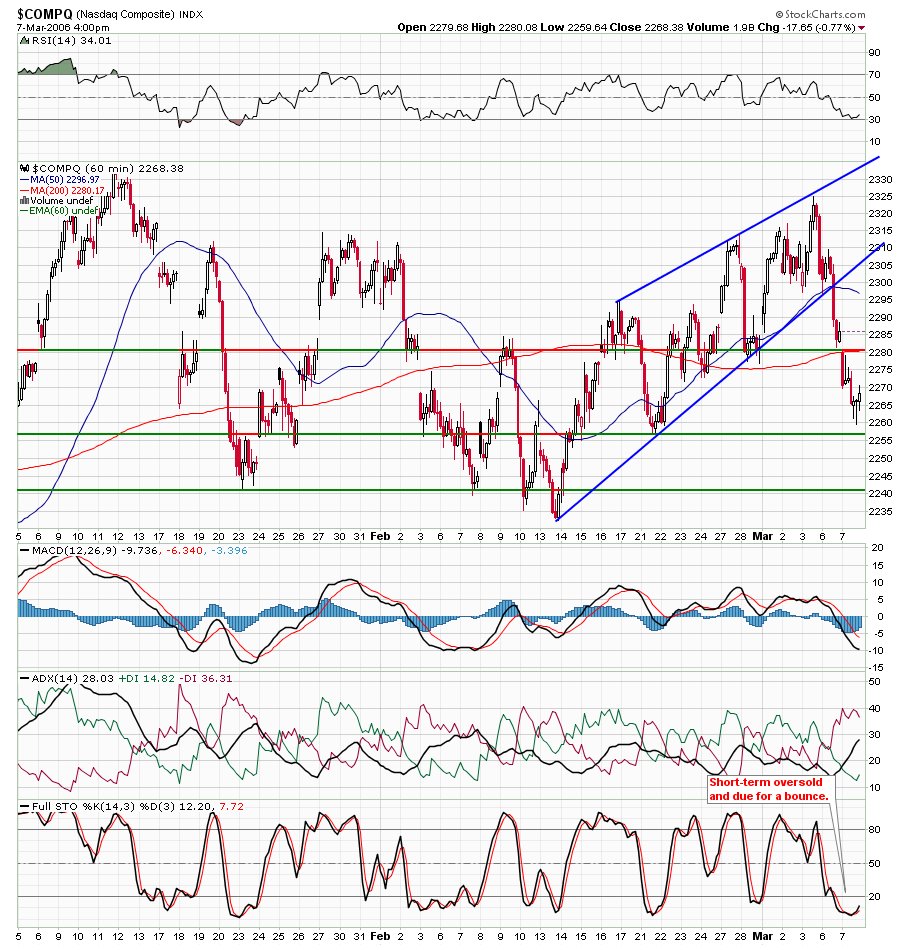
The shorter time frame is oversold.
The daily chart shows that we incurred some technical damage on a breach of the 50 day SMA, however, this was done on lower volume so there seems to be a lack of momentum. The 60 minute chart shows that we are deeply oversold after four successive down sessions (also confirmed by the McClellan Oscillator). The P&F chart shows that today's damage reversed the previously bullish direction and we are now in a correction phase which should take us to 2190 ie. close to where we started the year. All tech sectors were in the red today but the
SOX was the biggest loser, shedding 15 points or 2.9%. The
QQQQ's are lower in after hours due to
GOOG's latest blunder (refer to my previous post for more details). The top 10 losers on the Nasdaq include four semis:
MRVL, BRCM, SNDK, and
ALTR.

 The shorter time frame is oversold.
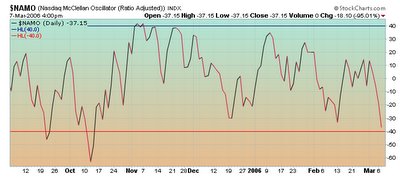
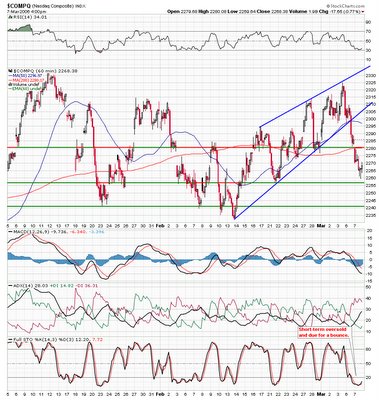
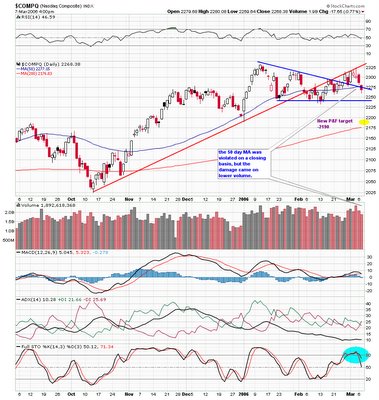
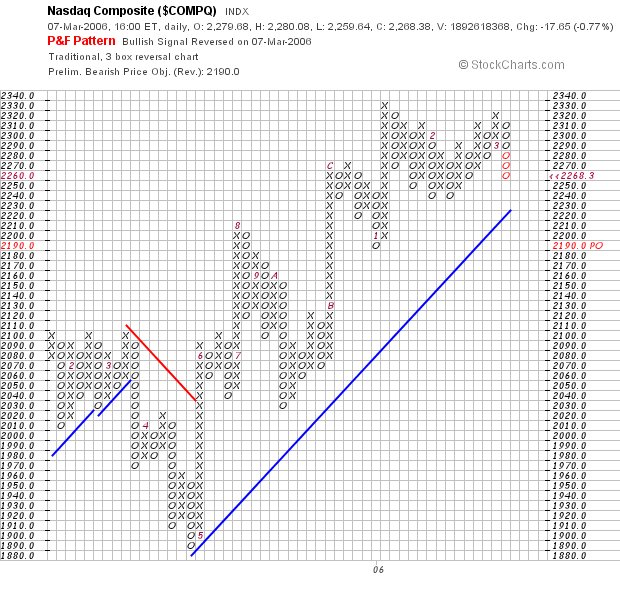
 The daily chart shows that we incurred some technical damage on a breach of the 50 day SMA, however, this was done on lower volume so there seems to be a lack of momentum. The 60 minute chart shows that we are deeply oversold after four successive down sessions (also confirmed by the McClellan Oscillator). The P&F chart shows that today's damage reversed the previously bullish direction and we are now in a correction phase which should take us to 2190 ie. close to where we started the year. All tech sectors were in the red today but the SOX was the biggest loser, shedding 15 points or 2.9%. The QQQQ's are lower in after hours due to GOOG's latest blunder (refer to my previous post for more details). The top 10 losers on the Nasdaq include four semis: MRVL, BRCM, SNDK, and ALTR.
No comments:
Post a Comment