The main scan I use is the basic 3 day breakout on high relative volume. If I see a familiar stock pop up on the scan, I check the chart to see if it meets my criteria for a breakout before I decide to take the trade. My criteria for a consolidation breakout is:
price break;
increase in volume;
rising ADX (momentum);
and stochastics above 50 and rising.
Here is an example of a trade I took on the bullish 3 day consolidation breakout scan this week.
TZOO showed up on the scan at 10:37 Wed. April 19th. From the chart, you can see that it met all of the criteria. Also, a view of the daily chart revealed that the stock had quite a way to go before running into gap resistance.
 The same applies for the bearish 3 day breakdown on high relative volume except this time, we look for the OBV and stochastics to be heading south. A good example of the breakdown is MATR which showed up on the scan at 9:32 Friday April 21st. From the chart below, you will see that it meets all of the criteria and a review of the daily chart revealed that MATR had just violated a key support area and had quite a ways to go until the next support area.
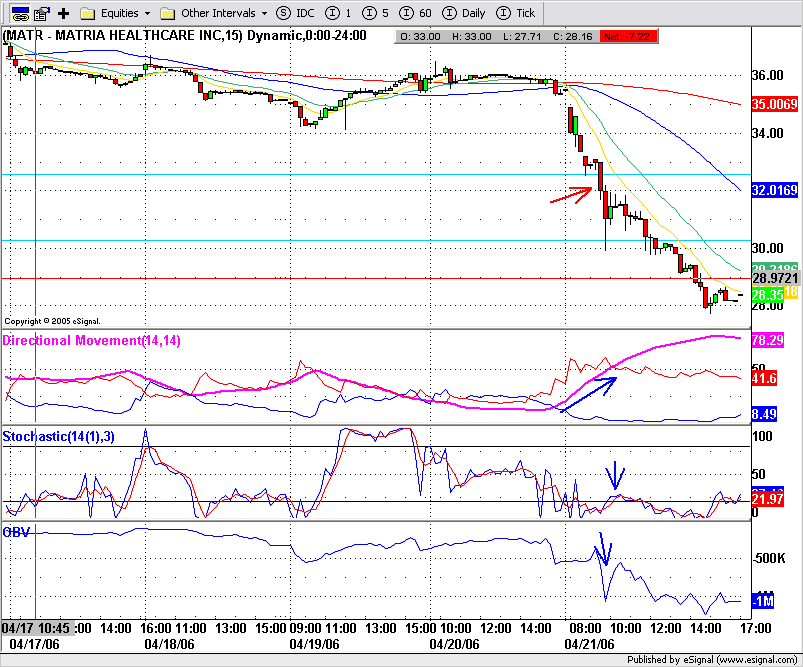
If one or more of the criteria are not met, the trade is not executed. Try to stick with familiar stocks, otherwise you might find yourself trading a stock with a big spread between the bid and ask and this could erode potential profits. Don't stay in the trade after the target has been met. Sell at least 50% of the position in order to lock in profits and keep a stop to protect the balance from quick snap backs.
If you are interested in Trade_Ideas, my affiliate link is located in the side panel.
No comments:
Post a Comment