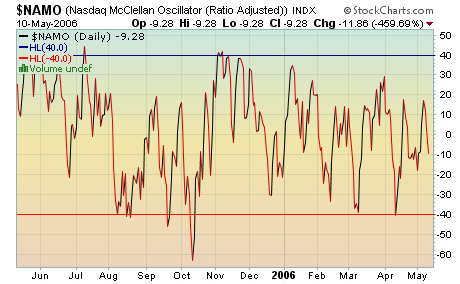
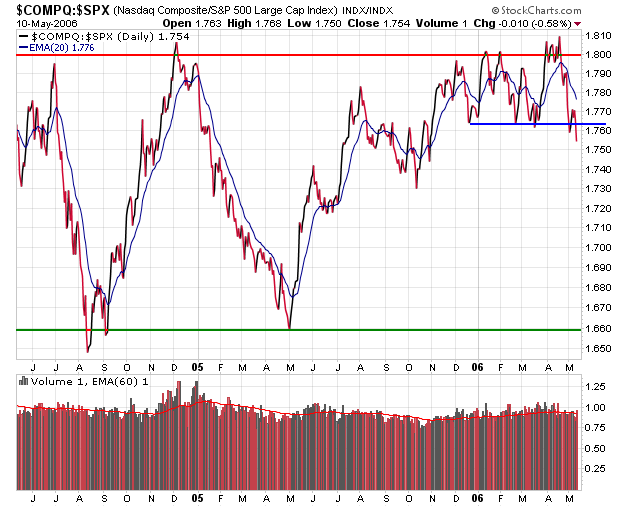
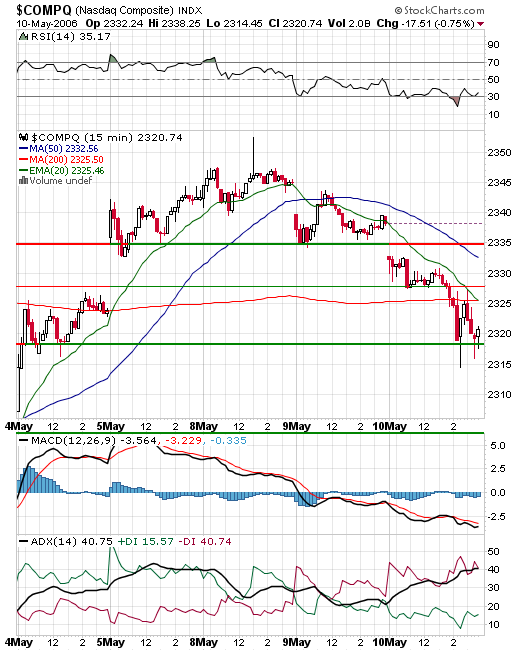
 The Nasdaq gapped down on the open and was never really able to bounce. A look at the 15 minute chart shows that it can't recapture its downsloping 20 period EMA and the EMA appears to be pushing prices down. There's no sign of any positive divergence, so the scenario looks like the path of least resistance is down. A comparison of the Nasdaq vs. the S&P 500 shows that since late April the Nasdaq has been underperforming on a fairly consistent basis. But despite all this negativity, we are far from oversold levels as per the McClellan Oscillator above.
Today the Nasdaq shed 17.5 pts. or 0.75%, lead by the SOX which lost 2.5% of its value. Volume was slightly higher as is the trend of late on bearish days. All major tech sectors ended the session in the red. The NDX losers were TEVA, ERICY, and ALTR, and the winners were PETM, EBAY, and CMCSA.
No comments:
Post a Comment