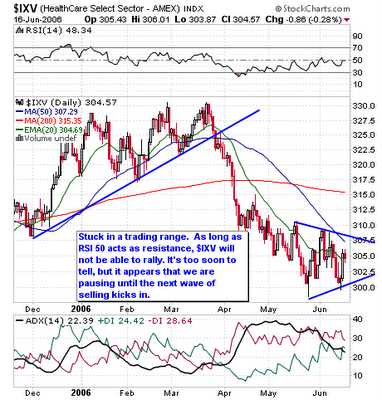
 From early 2006, the RSI on the $IXV chart started making lower RSI tops as price continued to make higher highs, creating a negative divergence. In late March the sector broke its trendline and took a steep fall which bottomed in late May. Since that time we have been in a trading range. If we use the RSI to measure the overall sector sentiment, we are still in bear market mode assuming the RSI uses 50-45 as support in a bull market and 50-55 as resistance in a bear market. You can use the trading range for short-term buying and selling, however, until sentiment turns bullish, there is a greater chance, that the sector will break the range to the downside with another wave of selling in the near-term. As long as the ADX line is moving down, the trading range remains intact, however, if it starts to flatten or curl up, get ready for the next wave.
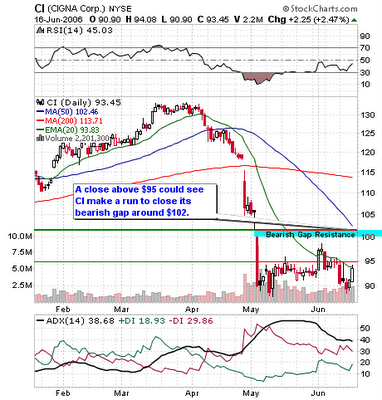
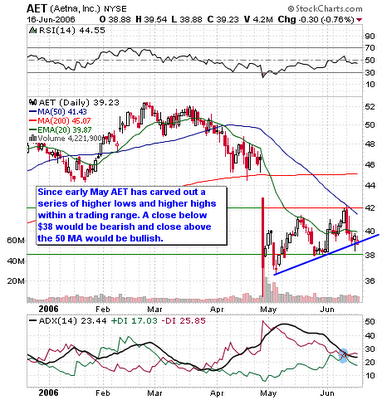
Here are some sector names of interest - CI, AET, and UNH. All of them have RSI readings below 50 and they are all trading in a range after a big fall. Read the chart notes for stock specifics.


2 comments:
Thanks for addressing these, Jamie. I'm hoping for a sustained market uptred that will help break these stocks out of their trading range to the upside. Their valuations are great compared to many other sectors. But, we all know that stocks often don't trade based on value.
Your welcome monkeydust,
I hope you're right but I still feel that the bears are just getting started and we have a couple more waves to go. Each wave will get smaller and shorter, but by the time we are finished going lower, many sectors will be really cheap.
Post a Comment