There was no reason to go long today as you can see from the 15 minute view of the NASDAQ, the ADX line did not give a buy signal on the morning bounce in price. It only started to perk up a bit in late afternoon trade as prices took out the morning lows. It was another lacklustre day with little momentum in either direction unless you were short semis. We are still hanging on to a higher low for now. And speaking of semis which lost 2.4% today and closed on the low, they are testing a long-term trendline. It will be interesting to see how this plays out in the coming days. The P&F chart has a target of 2060 for the NASDAQ, that's less than 100 pts. away but it could take weeks, if we continue to chop around like this.

 There was no reason to go long today as you can see from the 15 minute view of the NASDAQ, the ADX line did not give a buy signal on the morning bounce in price. It only started to perk up a bit in late afternoon trade as prices took out the morning lows. It was another lacklustre day with little momentum in either direction unless you were short semis. We are still hanging on to a higher low for now. And speaking of semis which lost 2.4% today and closed on the low, they are testing a long-term trendline. It will be interesting to see how this plays out in the coming days. The P&F chart has a target of 2060 for the NASDAQ, that's less than 100 pts. away but it could take weeks, if we continue to chop around like this.
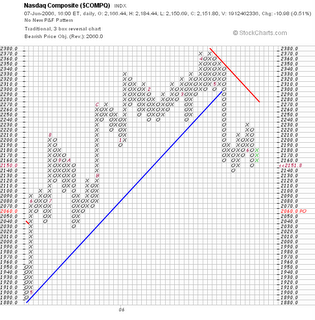
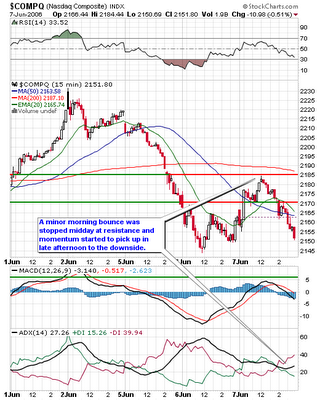
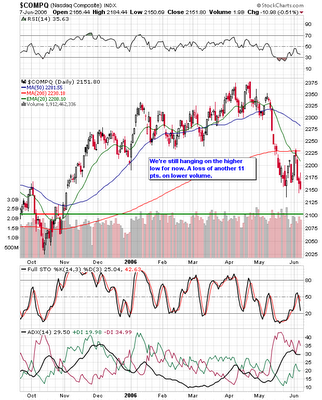
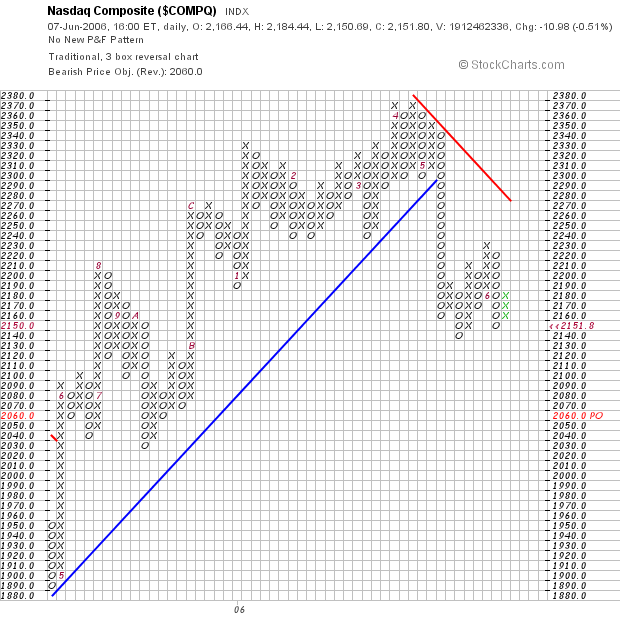
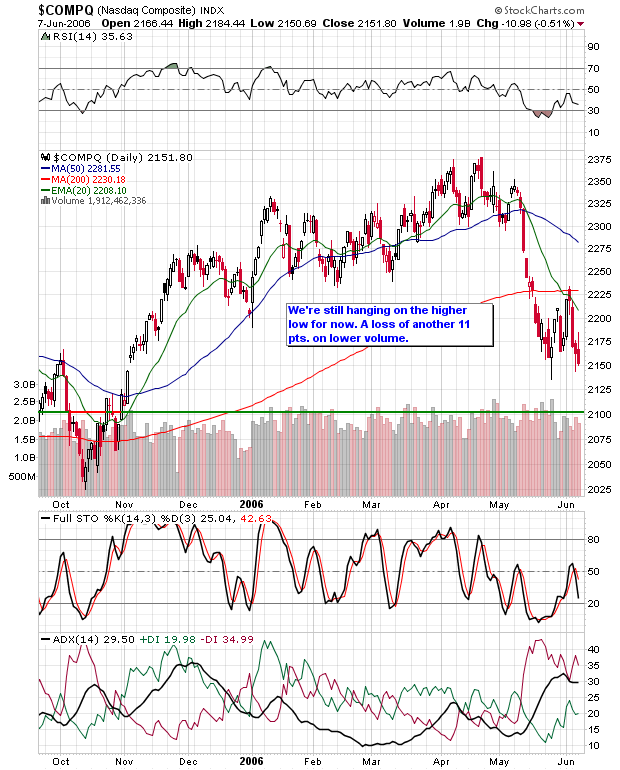
4 comments:
Hi Jamie,
You mentioned that the ADX line did not give a buy signal. Could you please explain how you would determine that?
Also from the PF chart you said that the target for Nasdaq was 2060, how did you determine that?
Thanks,
AJ.
Hi A.J.
I will do a post explaining the ADX line later Thursday night, but basically if the ADX line is flat, or has slight downward slope while prices are rising, there is no momentum supporting the price movement and it usually fails.
The point and figure charts measure the larger price movements and although, I don't understand the intricacies of plotting the points, I still like to monitor any change in direction and price target. Today we have a target of 2060 (indicated in red on the chart), and any swing in either direction could affect the target so I like to post the chart when a change occurs.
Hi Jamie, Dave,
Thanks for your responses. I did go to investopedia.com to check up on ADX before I posted this message, and they've mentioned the 20 and 40 level lines as being critical. Since in the charts the ADX was at level 30, I wasn't sure what that meant. But as Jamie said, the slope of the line can give out a signal.
Dave, I'll try to look out for the book you mentioned.
Thanks,
AJ.
Hi A.J.,
The upward slope of the ADX line is key in either an up or down trending market. As soon as the ADX line flattens or turns down, the existing trend or wave pauses or reverses. I will show you some examples this weekend.
In the meantime, as Dave pointed out, there are some good ADX notes in the chart school section of stockcharts.com
Post a Comment