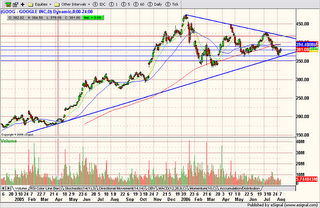
 GOOG has successfully tested its long-term trendline and has managed to hold it bullish gap support ($362.50) on the last two swoons. However, until it can recapture its 200 day MA, it is vulnerable to further weakness.
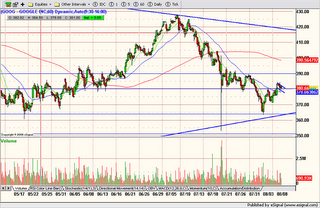
A look at the 60 minute view below, shows that GOOG is currently trading just above $380 (prior minor resistance) and appears to be forming a bullish flag. A successful break of the flag pattern could propel price towards the next resistance level of $390.

No comments:
Post a Comment