A continuation gap, also referred to as a runaway gap is an extension of the existing trend. It does not necesarily involve a price pattern. For example in an uptrend, if a good news story comes out in the after or pre-market, it fuels the bullish interest in the stock and the stock gaps up on the open.
A breakaway gap usually forms as part of a price pattern, for example a bullish base or a bearish base. Here is an example from last Thursday.
After a significant downtrend, NCS had been forming a bullish base (ascending triangle) for the entire month of August. On Thursday it gapped up, quickly retested it base and rallied for a gain of 5 points from the previous day's close.
 In the early going on Friday, NCS tested its rising 20 period EMA on the 15 minute timeframe, and continued its bullish momentum.
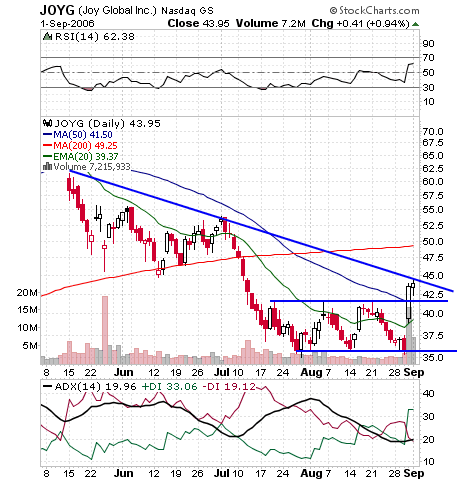
On Thursday, if you had spotted the bullish base on the daily view and mapped it out on the 15 minute timeframe, you would have noticed the test of the base and could have confidently taken a long position. It should be noted that NCS reported earnings on Wednesday AH. However, they missed by one penny on both the top and bottom lines. They did guide slightly higher for the next QTR and full year. Only 1500 shares traded in the combined AH and pre-market. It wasn't even mentioned on Briefing's gapper list on Thursday morning. I found it through a scan, however, I did not trade it. I opted for a more familiar name JOYG, an equally compelling breakaway gap up play.

Next we have the exhaustion gap which usually occurs just prior to the end of an extended up or downtrend. These types of gaps have a much better chance of getting filled than continuation and breakaway gaps and will be the subject of a future post. However, for the purposes of this post, if you identify your potential full gap long or short as an exhaustion gap, its best to move on, or fade the gap.
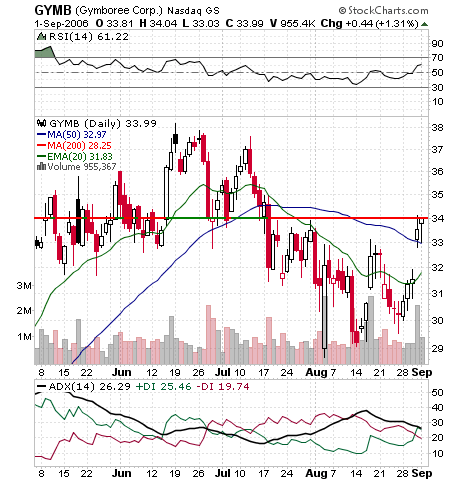
In summary, when trading gaps as part of a daytrading strategy, look for stocks that fit the profile of the continuation (runaway) or the breakaway gap profile. The breakaway gap has the potential for the strongest move as it is breaking out of a price pattern. Look for at least double the daily volume on the gap and ideally 4-5 average daily volume. If price moves to resistance in a bullish gap or support in a bearish gap and then volume drys up, its likely that the gap move has run out of steam and an exit is usually the best course of action. A good example of this last scenario is GYMB. The first chart is the 15 minute timeframe, followed by the daily. From the 15 minute view, we can see that it gapped up on high volume and rallied into resistance. When it reached resistance volume suddenly dried up. The daily view shows that GYMB gapped up and could not break resistance. If you were in this trade, you could have exited with a small profit or breakeven mid-morning when volume disappeared. Look for continuation of successfull breakaway gap plays into day two. Usually the stock pulls back to its rising 20 period EMA in early trade and then attempts to retest its previous day's highs. Refer to the examples above of NCS and JOYG for the day two setup. Remember that if a gap play fails, support/resistance is very far away. Respecting your stop is especially important when trading a gap.

No comments:
Post a Comment