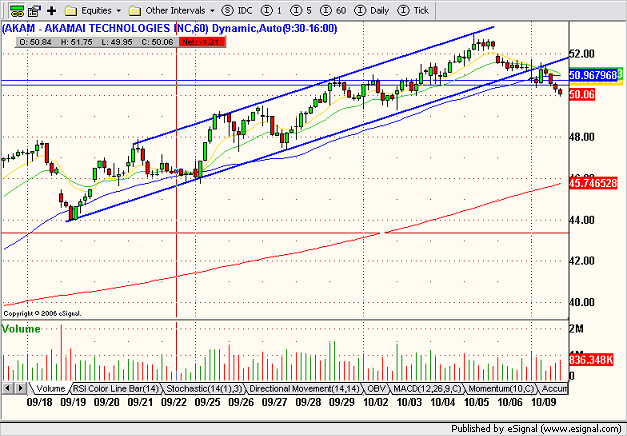
The above chart is a 60 minute view of AKAM. Notice how it broke its lower trendline in early trade this morning. I mentioned it as a potential short but was unable to borrow any shares through IB. So I stalked it for a potential bounce or a retest of the broken trendline.
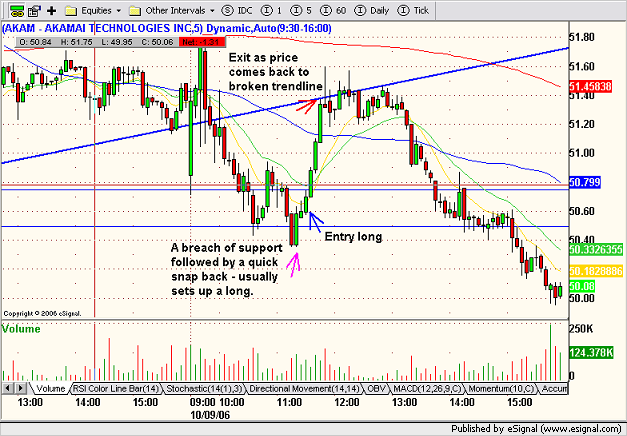
The five minute chart below shows how AKAM breached support at $50.50 but quickly snapped back setting up a long and a quick retest of the broken trendline before continuing its decent. My entry and exit are indicated by the blue (entry) and red (exit) arrows.
No comments:
Post a Comment