Appreciate if you could do a post-morton on this trade for me.I traded SNDK on both 5 min and 15 min chart. Looking at the daily chart, there is strong support at $44 and chart also seems to be potentially forming double bottom.2nd bar on 15 min chart printed a hammer. Entered long on break of 2nd bar high with stop below 2nd bar low. Target OR high.Stock went up but seemed to stall at previous day low. Held on the trade till stop loss triggered at 12th bar.Pls advice if there's anything wrong with this setup or with my entry / exit. Thank you.
Okay, so lets look at the daily timeframe first. This is the SNDK chart prior to the open Wednesday.
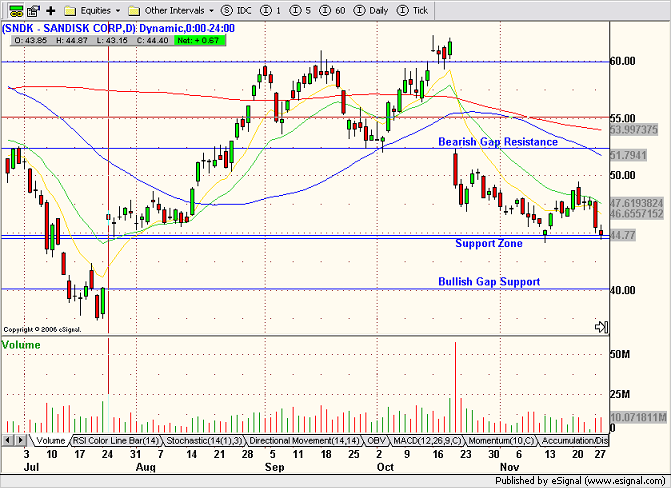 The key take away here is that SNDK is sitting on the upper support line of a bullish gap support level. Going into the trade that support level has been recently tested twice and held.
 Now let's look at the 15 minute chart of the actual trade:
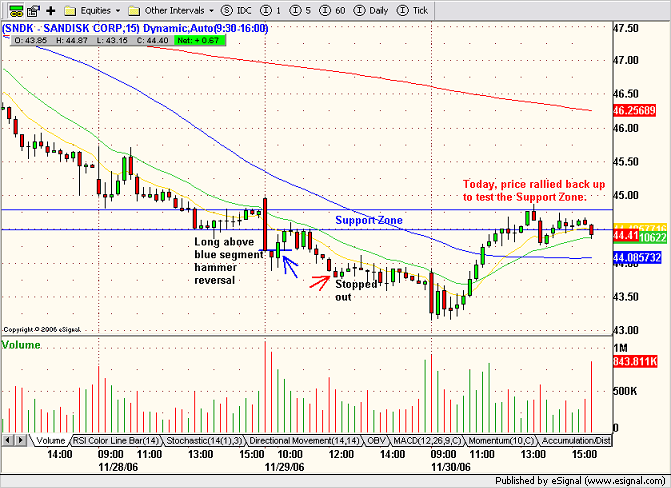
 The key take aways here are the breach of the support zone (SZ) on the opening range (OR) bar. Also note, the angle of the downward sloping MAs. The second bar carved out a hammer reversal and a long entry was taken on a break of its high. Price rallied back up the the SZ tagging the downsloping 20 MA, but closed just on the periphery of the SZ. Notice how the rally took place on declining volume. After pulling back, price tested the SZ a second time before retreating back into its bearish trend.
So the long entry was good as a scalp, but when the first test of the support zone failed, at least 50% profit should have been booked at the support line. The second failure is a red light and the stop should be tightened to breakeven.
The reason I'm calling this a support zone is because on both tests November 13th and 28th, SNDK, spent hours trading within the zone. I slotted these lines in last night when I read Zen's comment. Just to show you the importance of drawing in all of your support and resistance lines before entering the trade. Let's look at what happened today.
 Okay, so today's open was pretty similar to yesterday's, except about an hour into the session, SNDK started to carve out a bullish rounded bottom and the second half that bottom was on rising volume. A low risk entry could have been taken on the 7th bar open with the SZ as the target.
5 comments:
Excellent analysis Jamie. Haven't dropped a comment in a while, but you have been making some excellent trades as well. Keep up the good work.
DT
Thanks DT,
And you as well. I noticed a lot of interesting posts on your blog. You've been jazzing it up quite a bit lately. Now I know that you're a card shark as well as a daytrader, oh and I love the photos. Nice work!
Hi Jamie,
Thanks for this awesome analysis. You are right, on hindsight, I should have closed my position partially when it started to stall.
On today's potential long entry: for such u-shaped setup, does entry have to be near the high of the OR (i.e complete setup of U shape) to confirm?
Since SNDK retested the support area but did not break, do you think it is a good candidate for short tomorrow?
Thanks, Zen
You're welcome Zen.
To answer your first question - A break of the sixth bar high would have been enough confirmation. Notice how it lines up pretty well with yesterday's low.
To answer your second question - I don't think so unless the markets go into another free fall. Looking at the daily timeframe, I'm thinking we may need to consolidate this last leg down a bit more before a good shorting opportunity opens up. I won't be surprised to see some NR trading in SNDK tomorrow.
If on the off chance, it gaps up above the SZ, comes in to test from the other side and it holds, it will be a good long setup. But I'm not holding my breath.
Thanks Jamie.
Zen
Post a Comment