You're right, my bearish take on AKAM is not adaquately reflected in last night's post.
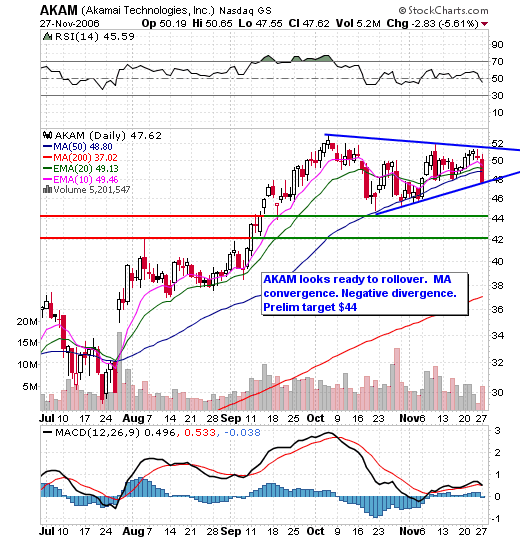
Basically, I am looking at the pattern of successive lower highs. Price peaked in early October and since then, AKAM has carved out two lower highs, the latter of which was a rounded top. Rounded tops are extremely bearish. The three MAs 10, 20 and 50 are converging and will likely crossover in an effort to push down price. Once the crossover takes hold, price will not likely be able to close above the MAs, triggering a slide.
The negative divergence is a little hard to see on the daily chart, but take a look at the weekly timeframe and you will see that despite price levels at multi-year highs, the RSI has pulled back to much lower levels than the first half of the year. The MACD has crossed over on both the daily and the weekly.
Momentum is flat at 15.5 down from 40+ in October. And the cherry on the cake is that the P&F chart signaled a double bottom breakdown today, with a preliminary target of $42.00.
I have not shorted yet, but I'm watching it closely.
Hey Quinn, Right now I'm looking at the 15 minute timeframe and I see that yesterday it carved out a higher low. Now it faces the challenge of the downsloping 50 MA. If it takes out the 50, it will likely rally back up to the 200 MA. If it can't take out the 50, I could go short on a high volume break of $47.00. However, I'm not optimistic that this will happen today. I don't like to take short positions too late in the session. I'm taking it one day at a time and will post regular updates.
4 comments:
Jamie,
Could you elaborate a bit on your read of this chart? What's significant about MA convergence? Negative divergence between price and what else?
Hi Quinn,
You're right, my bearish take on AKAM is not adaquately reflected in last night's post.
Basically, I am looking at the pattern of successive lower highs. Price peaked in early October and since then, AKAM has carved out two lower highs, the latter of which was a rounded top. Rounded tops are extremely bearish. The three MAs 10, 20 and 50 are converging and will likely crossover in an effort to push down price. Once the crossover takes hold, price will not likely be able to close above the MAs, triggering a slide.
The negative divergence is a little hard to see on the daily chart, but take a look at the weekly timeframe and you will see that despite price levels at multi-year highs, the RSI has pulled back to much lower levels than the first half of the year. The MACD has crossed over on both the daily and the weekly.
Momentum is flat at 15.5 down from 40+ in October. And the cherry on the cake is that the P&F chart signaled a double bottom breakdown today, with a preliminary target of $42.00.
I have not shorted yet, but I'm watching it closely.
Hope this is helpful.
Jamie,
Yes, very! Thanks for the detailed analysis.
What would trigger a short entry for you here?
Hey Quinn,
Right now I'm looking at the 15 minute timeframe and I see that yesterday it carved out a higher low. Now it faces the challenge of the downsloping 50 MA. If it takes out the 50, it will likely rally back up to the 200 MA. If it can't take out the 50, I could go short on a high volume break of $47.00. However, I'm not optimistic that this will happen today. I don't like to take short positions too late in the session. I'm taking it one day at a time and will post regular updates.
Post a Comment