Thursday, August 31, 2006
NASDAQ Technical Picture - No Traction Pre-Holiday Trade
 Not too many buyers ahead of the long weekend. A NR day on slightly higher volume. Expect more of the same tomorrow.
We have lots of economic data tomorrow starting with non-farm payrolls at 8:30, followed by Mich. sentiment at 9:50 and construction spending and ISM at 10:00.
Trade of the Day - Joy Global Inc. (Public, NASDAQ:JOYG)
 A low risk dummy entry as JOYG lifted from support of its midday consolidation. Notice how there is very little overlap of the real bodies of the candlesticks as JOYG makes its ascent. These are my favourite types of trades.
This morning I took a long position in AKAM which basically failed to rally to the $40.00 resistance level. I had a partial sell limit order at $39.95 but it never got tagged so I managed to squeeze $0.40 on a lower high midday.
Pre-Market
Gapping Up: CYTR +17%, SEAC +15%, JOYG +7.8%, OLAB +7.3%, GYMB +5.5%, CIEN +5%, RCL +5%, JWN +4.8%, LWSN +4.3%, FRED +4.3%, RMBS +4.2%, BEBE +2.2%, NVLS +1.6%... Gapping Down: AD -29%, JOSB -15.8%, JDSU -10.6%, LTXX -8%, DRYS -5.5%, PSUN -4%, BOBJ -1.3%, ASML -1%... ETF Movers: GLD +1.2%, QQQQ +0.18%, OIH +0.40%, XLE +0.32%
Wednesday, August 30, 2006
Watch List - CTXS, VRTX, BRCM, MXIM
 CTXS made a higher high in mid August and now $30.00 looks solid as support and a higher low. Look for a high volume bounce above the 20 EMA.
 VRTX looks poised to start the next leg up.
 BRCM has formed a bullish rounded base. Buy on a high volume break. Near-term target is $32.50.
 MXIM has almost completed a mini H&S bottom. Buy on a high volume break of $30.00. On a measured move basis, it could go to $34.00 in the near-term.
NASDAQ Technical Picture - Resistance Just Over Head
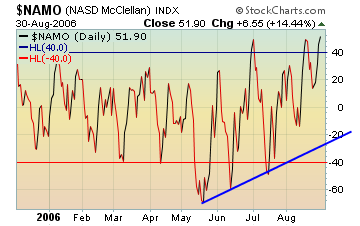 The McClellan Oscillator is indicating that the NASDAQ is overbought. The NASDAQ rallied in the morning and again in the middle of the afternoon and managed to hold on to most of its gains into the close. We are heading into resistance set by the July highs so tomorrow should be a cautious day for the bulls as we will likely get some profit taking. However, we have a few economic indcators that may set the tone: Initial claims at 8:30; followed by Chicago PMI and Factory Orders at 10:00.
Trade of the Day - Lam Research Corp NASDAQ (LRCX)
 I was not able to trade the open or most of the morning due to office deadlines. However, I did catch a few midday entries which played out very nicely. The best trade was a low risk entry in LRCX which generated 1+ pts. I also placed a buy stop limit order in BRCM just above morning resistance. It had a nice rally after it retested resistance (which now acted as support).
 15 minute charts - click to enlarge
My only other trade was CHS (entry at $18.00) and I'm swinging it into tomorrow.
Pre-Market
TZOO from hold to sell; PCLN from buy to hold. Too bad because TZOO was consolidating its recent gains very nicely and setting up for a potential breakout.
Watch List:
I'm sticking with the usual suspects going into today's session. Specifically, I'm looking at names that closed the session on or near their afternoon highs: AKAM, NVDA, JCOM, AAPL, BRCM, CKFR. Also don't forget CHS, profiled here on Monday night. It is setting up for a bullish retracement on a trading basis (not an investment recommendation). It was mentioned as a possible bullish island reversal on CNBC by the guest host this morning.
Tuesday, August 29, 2006
NASDAQ Technical Picture - Bulls Take Back Control of Choppy Session
We carved out a hammer like continuation bar on higher volume as the bulls and bears battled it out for most of the session. Lower consumer sentiment shifted the power to the bears in the early going and the bulls took back control on the heels of a disjointed FOMC message in the latter part of the session. The SOX and networking stocks paced the way to the upside and most major tech sectors were in the green by the end of the day. Watch for Crude oil inventories at 10:30 tomorrow.
Trade of the Day - Akamai Technologies Inc. NASDAQ (AKAM)
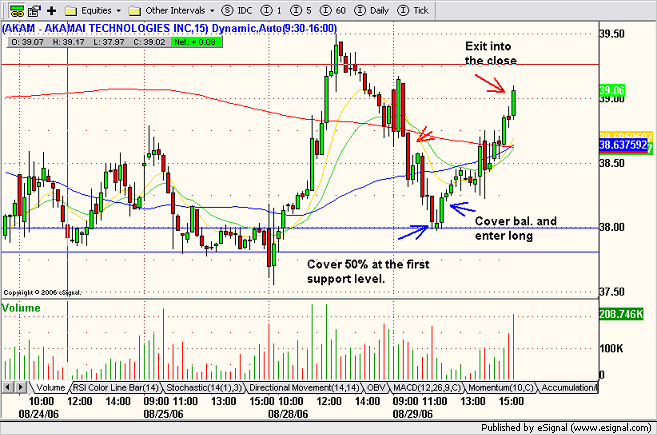 I was hoping for a long setup on AKAM going into the session, but the early action was very choppy and the wide range bars did not create an opportunity for a low risk entry. After lower than expected consumer sentiment numbers were released at 10:00, we came into some continuation on the fourth bar and an opportunity to short. I covered 50% of the position as it tagged the first support level. I covered the balance of the position when I saw continuation to the long side about a half hour later. I immediately took a long position, hoping for a retest of yesterday's highs. By the end of the session we managed to get back close to the morning highs. I exited the trade into the close. This was not an easy trade and required constant attention just to make sure that direction was not about to change.
Watch List - AKAM, TZOO
 After a lower low on the open, AKAM made a parabolic intraday move to the upside on higher volume. The afternoon saw a 38% Fibonacci retracement. Look for continuation of the bullish momentum. Preliminary target is $40.00, followed by $42.00.
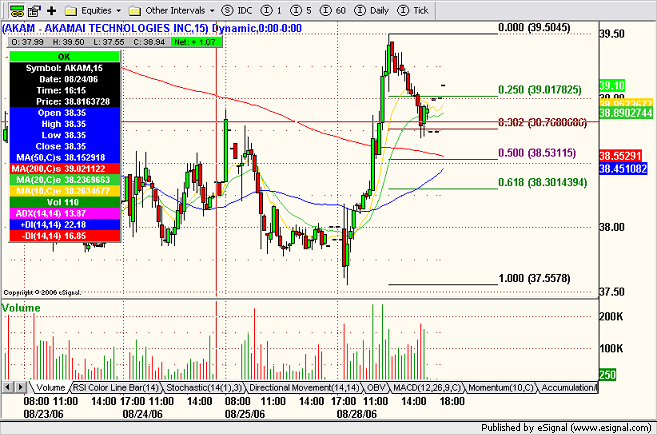
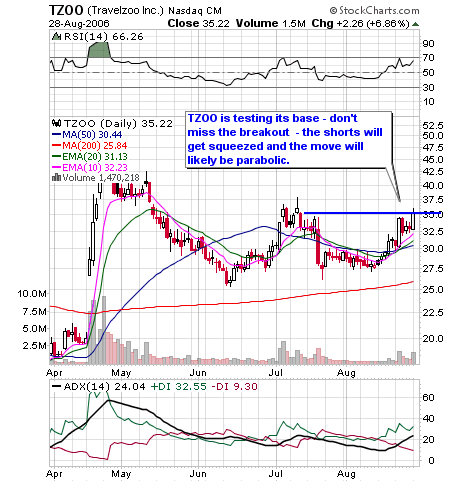 TZOO is testing its base and could breakout anytime. Don't miss the move as it will be a short squeeze.
Monday, August 28, 2006
Blogger Problems Loading Images
Chico's FAS, Inc. (Public, NYSE:CHS) - TA Request
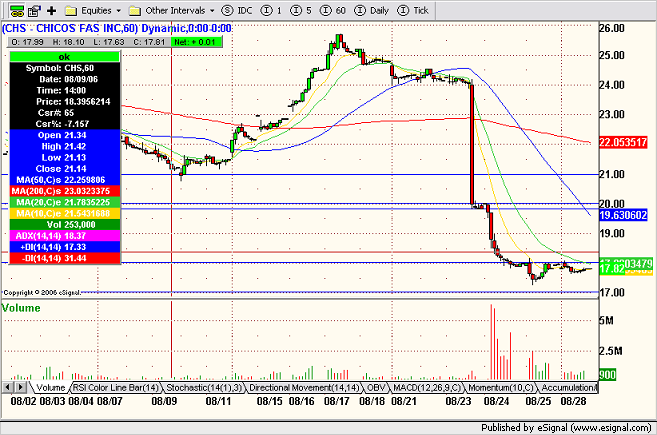 This is a 60 min. view of CHS. The stock capitulated last Thursday following its earnings release. Today it made a higher low and looks poised to bounce if it can regain its 20 period EMA or trade above $18.00. This is a very short-term trade. Resistance at $20.00 followed by $21.00.
OmniVision Technologies (Public, NASDAQ:OVTI) - TA Request
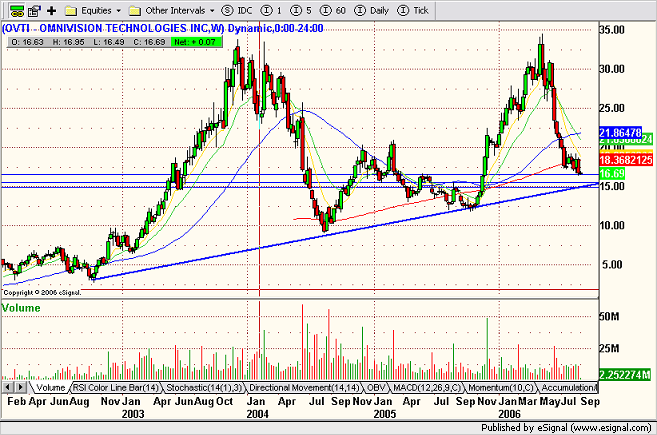
OVTI has three levels of support along its rising trendline on the weekly view. First we have $16.55 which was hit last week, followed by $15.55 and $15.00, the latter two of which mark the open and close of bullish gap support dating back to November 18th, 2005. OVTI is trading below all of its MAs, however, it will likely come into a technical bounce in the near term as it approaches its long-term trendline. Failure to hold the trendline could signal a double top breakdown.
Notwithstanding the pure technical aspects of the chart, I am reading that one of the co-founders and senior sales executive is leaving the comapny to persue other interests. This type of news is normally very negative for a stock's price, but in this case, it may already be priced in. I, personally don't recommend going long before a clear reversal pattern presents itself.
NASDAQ Technical Picture
Despite the low volume action, both the COMPQ and QQQQ's are moving forward according to plan. All major tech sectors ended the session in the green with internet retail leading the way on news of AMZN's stock buyback and a GOOG/EBAY alliance. The SOX also got a boost from upgrades for NVDA and INTC, although NVDA fell victim to some profit taking as it attempted to fill its bearish gap resistance dating back to May 12th.Watch for consumer confidence tomorrow at 10:00 and FOMC minutes at 2:00 p.m.

Trade of the Day - CheckFree Corporation (Public, NASDAQ:CKFR)
 As per this morning's watch list, CKFR opened lower and tested the 38% Fibonacci retracement level from Friday's high to Thursday's low. I watched it trade in a very narrow range for the first 5 - 10 minutes and placed a buy stop limit order at $35.05. The rest was a smooth, orderly ascent to test resistance at $36.00 where I locked in 50% of my profit. I moved my stop to $35.75 and by mid-afternoon, I moved it up again to $35.95. I exited the balance of the position into the close.
Watch List - CKFR
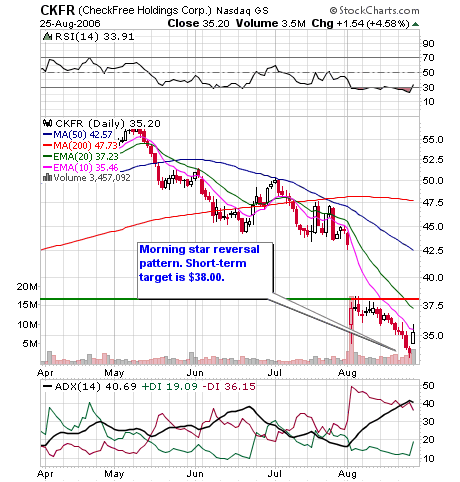 Technical Bounce - Last Thursday CKFR fell into its 200 day MA on the weekly timeframe and started to reverse. Friday it gapped up on an upgrade and this resulted in a morning star reversal pattern. Look for continued upside and a preliminary target in the $37.50 - 38.00 area.
Sunday, August 27, 2006
NASDAQ Technical Picture - Low Volume Consolidation
The NASDAQ is in a low volume consolidation phase as it continues to trade within in its bullish flag pattern.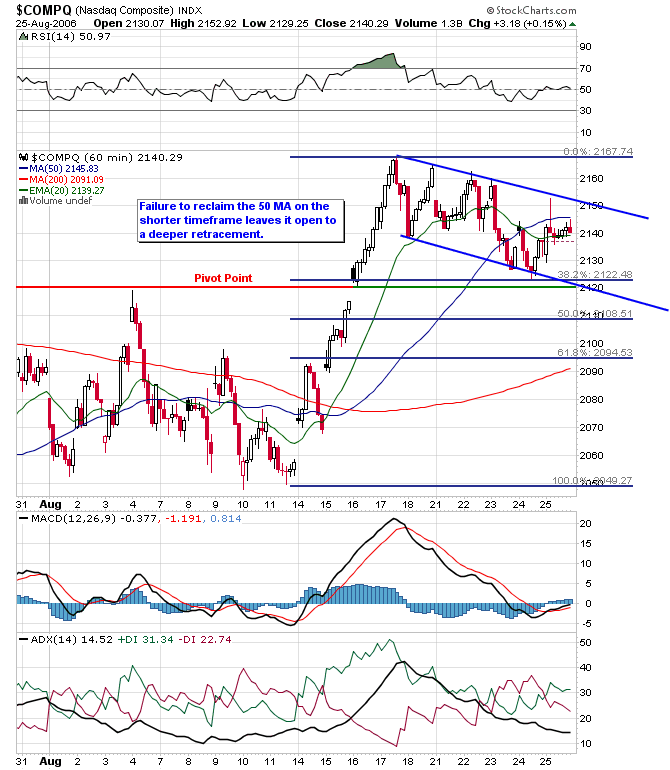
Failure to reclaim the 50 period MA on the 60 minute timeframe leaves the NASDAQ open to further retracement.
Friday, August 25, 2006
Trade of the Day - Research in Motion NASDAQ (RIMM)
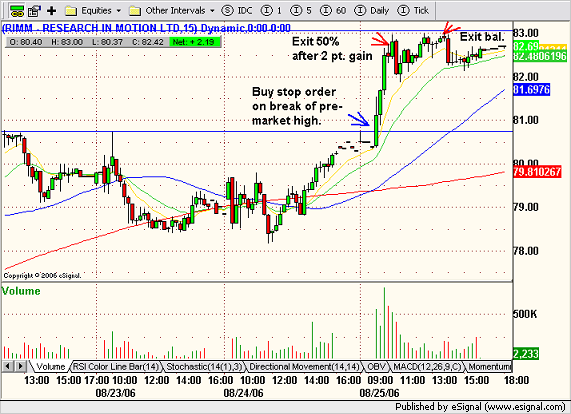 Just before leaving for work, I read something on Briefing.com regarding increased handset expectations and decided to place a buy stop order above the pre-market high. This news was the cherry on the cake so to speak, because yesterday RIMM had a strong finish and I was planning to watch carefully for a strong open. I locked in 50% profit at the 10:00 - 10:15 reversal time and exited the balance as RIMM failed to take out $83.00 on the third attempt. Volume was thinning out and it couldn't even manage a gap fill at $83.06 (April 6th).
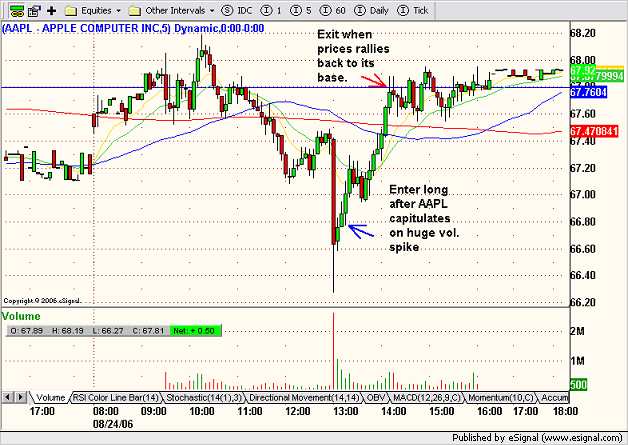
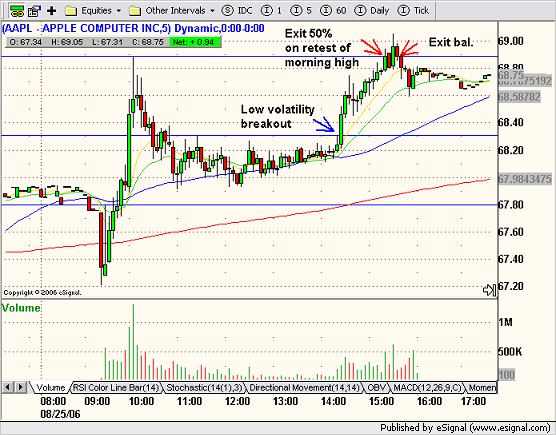 This AAPL trade is an example of a low volatility breakout (referred to as the squeeze by John Carter). Notice how volume drys up midday as the stock trades in a very narrow range. It forms a shallow base and as price approaches resistance volume starts to perk up. I used a buy stop limit order on the entry just above $68.31. My target was a retest of the morning high at which point I locked in 50%. When price backed off of the $69.00, it was time to think about closing the position.
Mailbag
Suntech Power Holdings Co., Ltd. (Public, NYSE:STP) - TA Request
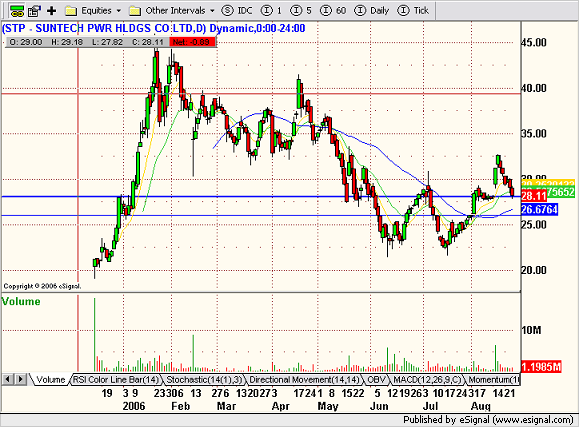 From a purely technical perspective, STP should get a technical bounce here as there is a lot of support at $28.00 going all the way back to Dec. 2005. However, acquisitions are in play. Next level of support $26.00.
Thursday, August 24, 2006
NASDAQ 100 Shares: NASDAQ (QQQQ) - Tweezer Bottom Reversal Pattern

Tweezer bottoms are minor reversal candlestick patterns. However, as I mentioned last week, my experience is that they are fairly reliable. They form when two candlesticks have identical lows. In the case of the QQQQ, $37.92 was the low yesterday and today. According to Steve Nison, the pattern is more meaningful when the first bar has a wide body and the second bar has a narrow body. In our case, yesterday's bearish engulfing bar has been neutralized by today's NR doji like stick. Moreover, this price action took place strategically above bullish gap support.
I ran a quick scan to see if any other names formed tweezer bottoms today: ORCL, SMH, PLCM, and ALTR. Let's see if we get any follow through tomorrow.
NASDAQ Technical Picture - A Weak Open and a Strong Close
Today's low volume choppy session was a bit of a snooze fest in the morning. However, the afternoon session perked up a bit and I noticed that many of my usual suspects closed the session strong, which leaves me optimistic going into tomorrow. The NASDAQ carved out a NR hammer like stick on low volume. Despite the morning swoon, no technical damage was done and the all important SOX had a great afternoon led by a huge rally in SNDK on a Caris upgrade.
Trade of the Day - Apple Computer Inc. NASDAQ: AAPL - Midday Capitulation Play
 Around midday AAPL capitulated on a huge volume spike. As soon as a reversal was confirmed, I took a long position. When a stock capitulates intraday, it sets up a reversal back to the base from where the selling began. As soon as price reached my target, I booked my profit. These types of plays, generally happen quickly so as soon as you see a huge volume spike at the end of an intraday price plunge, its time to find your entry point.
Wednesday, August 23, 2006
Watch List - CEPH, ATHR, NVDA,
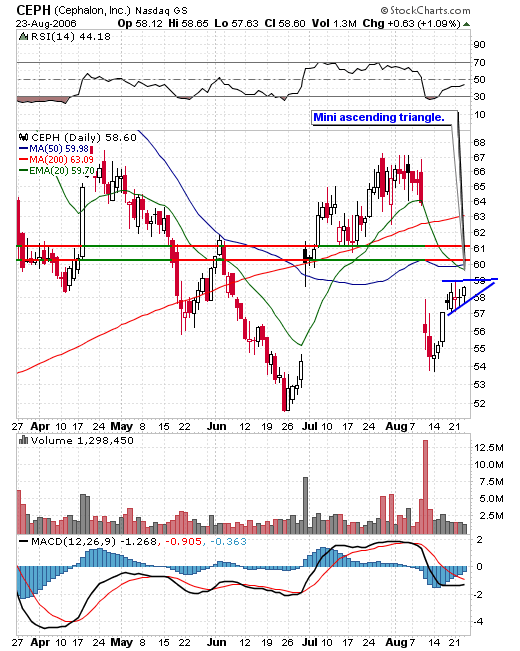 CEPH closed on its highs and looks well positioned to attempt a breakout any day now.
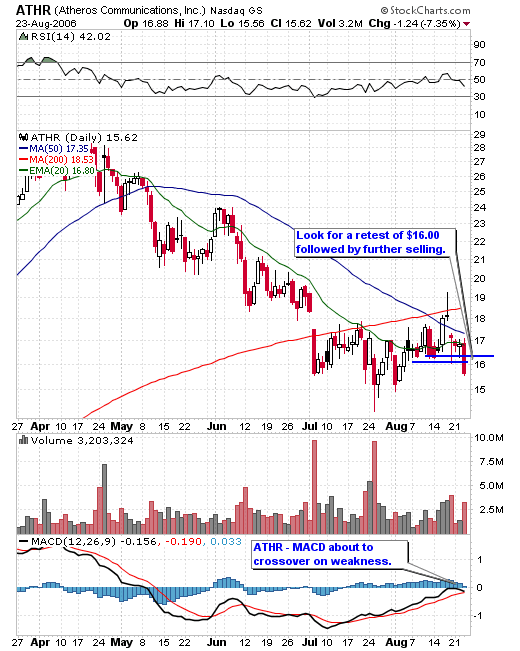 ATHR fell through its pivot on a closing basis. Look for a possible retest on the open followed by further selling.
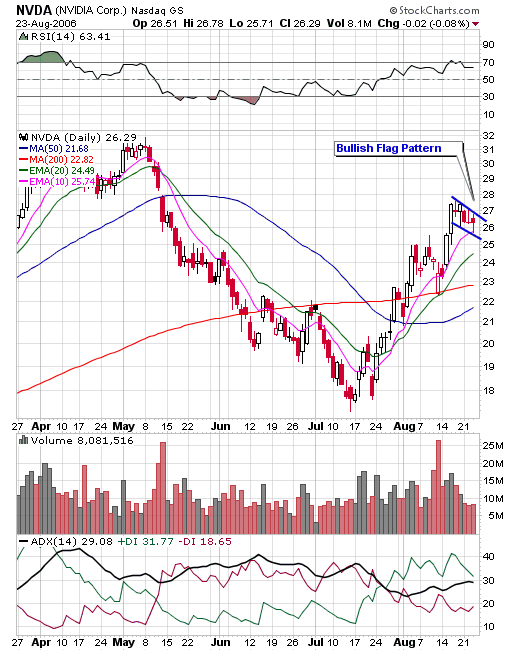 NVDA tested its 10 day EMA and showed some strength into the last hour of trade. Look for continuation on the open. Initial target is $27.00, followed by $27.50.
NASDAQ Technical Picture - A Low Volume Bearish Engulfing Pattern
The NASDAQ carved out a low volume bearish engulfing candlestick today. Shortly after the open the bears took control of the session and it wasn't until late in the session when we tested the 10 day EMA that some buyers started coming back in. The NASDAQ shed 15 points on the day but the daily chart still looks good, in fact we may be in the process of forming a bullish flag pattern.
Trade of the Day - Research in Motion NASDAQ (RIMM)
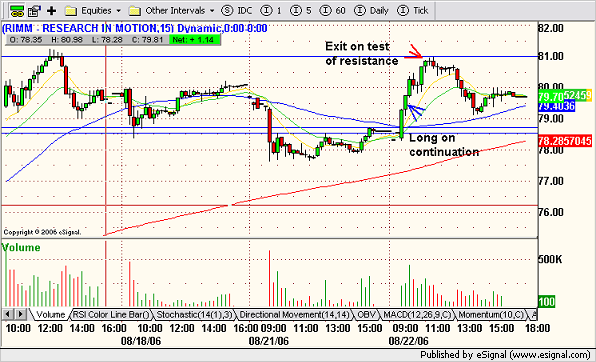
 Long RIMM on a break of the OR (opening range) high. I couldn't have been in the trade more than 5 minutes before it started coming back in fast, so I took my exit right away before it turned into a loss. The next bar confirmed that this was a failure so I started looking to take a short position because failures usually result in deep pullbacks. As soon as the next bar showed me a little continuation I shorted. My target was a retest of $78.00. By mid-afternoon that target started looking unattainable so I covered 50%. I was stopped out on the balance shortly thereafter.
Tuesday, August 22, 2006
Watch List - AKAM, TZOO, EBAY
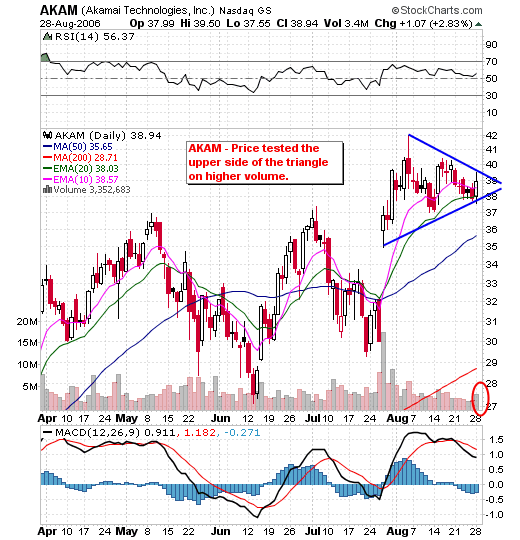
 AKAM appears to be forming an ascending triangle. Long on a break of $39.00. Target is a retest of the $40.00 area and hopefully a successful break of the triangle pattern.
 I took TZOO off of my short list of usual suspects about two weeks ago. Big mistake, good things come to those who wait. The shorts got squeezed today and we may have a double bottom.
 The internet sector looks poised to break higher and EBAY may be in the mix this time round.
Stocktickr Interview
NASDAQ Technical Picture - Consolidation is Good
Another low volume, consolidation day. We need this after last week's big gains. And I expect more of the same early tomorrow unles we get some sort of catalyst. Existing home sales data will be released at 10:00, followed by crude oil inventories at 10:30.Most tech sectors ended the session in the green with the SOX and software, the major exceptions. The internet sector ($GIN) had a good day today and looks poised to break higher.
Trade of the Day - Research in Motion NASDAQ (RIMM)
 RIMM followed the market and opened strong despite relatively average volume. The first bar was a wide range bullish bar. I waited until the second bar showed some green, confirming continuation before stepping in. My target was a retest of last Thursday's highs. The target was reached in late morning and I sold my entire position into strength as price approached $89.00.
From last night's watch list - PAYX didn't trigger a long. I took a long position in RBAK at $18.20 in the late morning but it stalled at $18.50 resulting in a scratch.
Monday, August 21, 2006
Watch List - RBAK, PAYX
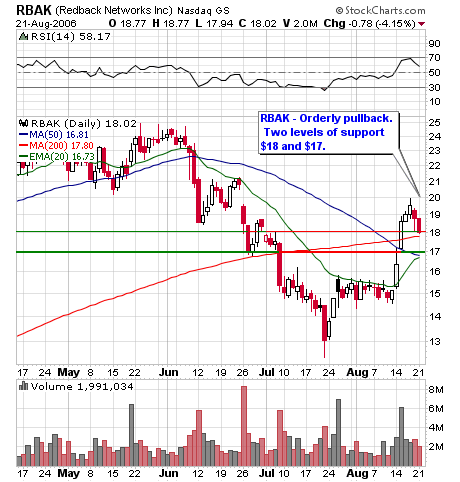 RBAK is pulling back to support in an orderly fashion. Look for a reversal setup in the area of $17.00 if $18.00 doesn't hold.
 PAYX long on a high volume break of resistance at $36.00. Potential hurdle is the 50 MA currently tracking at $36.30. Initial target is $37.00. I saw some late day strength in this stock when the rest of my charts were fading into the close.
NASDAQ Technical Picture - Low Volume Consolidation
This type of low volume consolidation is very bullish. Another day or two like this will give the 10 day EMA time to catch up to price. The SOX and internet led the pullback. Some of last week's big winners were today's big losers, however, BRCM and NVDA, the two worst performing NDX 100 names, only gave back 3.7%.
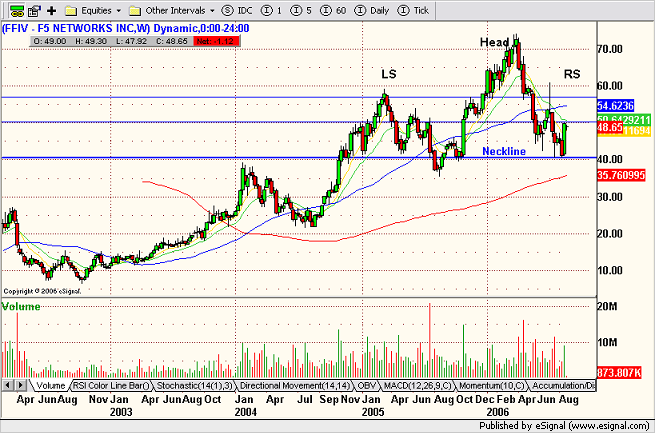
F5 Networks Inc. NASDAQ: (FFIV) - Double Bottom?
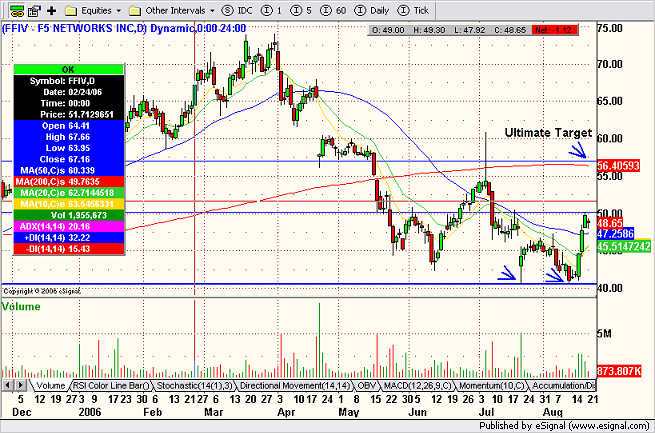 A reader asks if FFIV has made a double bottom? In the very short-term it has, however, a closer look at the longer time frame below (weekly), indicates that FFIV has reversed off of its neckline and that it may be in the midst of its last bounce before completing a H&S top.
So in the short-term, and after consolidating last weeek's big gains, it might retest the $57.00 area, however, it will likely find its way back down to the neckline shortly thereafter.
Trade of the Day - Akamai Technologies Inc. NASDAQ (AKAM)
 Long AKAM as it reverses off of its pivot point. The target was a gap fill. Unfortunately, all of the MAs converged above price at the halfway point and AKAM could not reach the target. I moved my stop up to $39.50 and was stopped out. On the following 15 minute bar, I decided to go short hoping that the pivot would not hold as support on the next test. It took most of the day, but price finally broke support mid-afternoon and after a retest, fell hard in the last half hour of the session.
 As per last night's watch list, long NVEC on a reversal from support at $26.30. Although, I managed to pocket $0.75 on the trade, this type of reversal is usually good for a retest of recent highs. Today's market was just too weak.
Sunday, August 20, 2006
Watch List - AKAM, CMCSK, INFA, NVEC
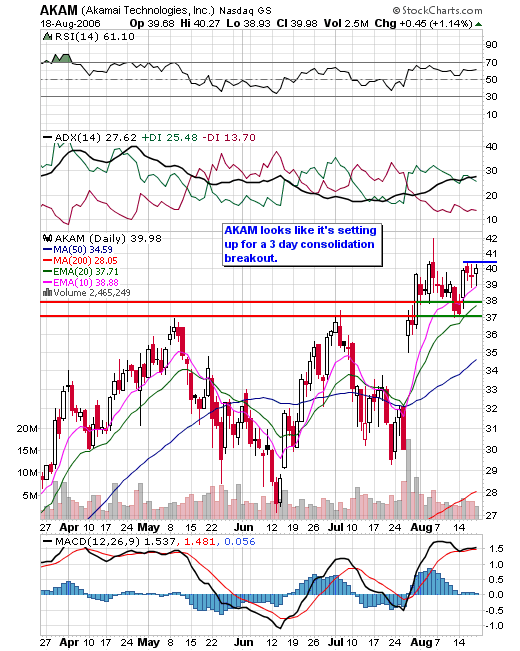 After gapping up on earnings, AKAM has tested two levels of support and looks well positioned to begin the next leg up.
 CMCSK has been consolidating its gap up for most of the month of August. It looks like it could break higher any time soon.
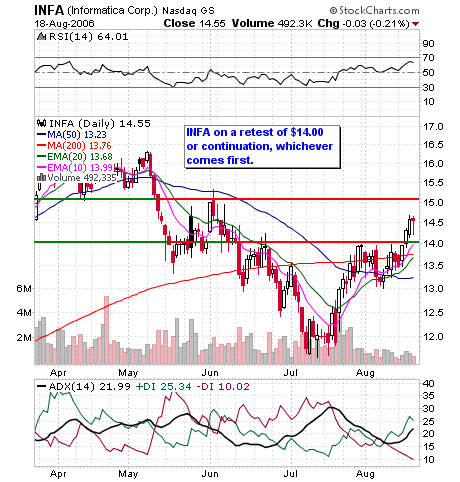 INFA would be nice on an intraday pullback to $14.00 but it may just push higher.
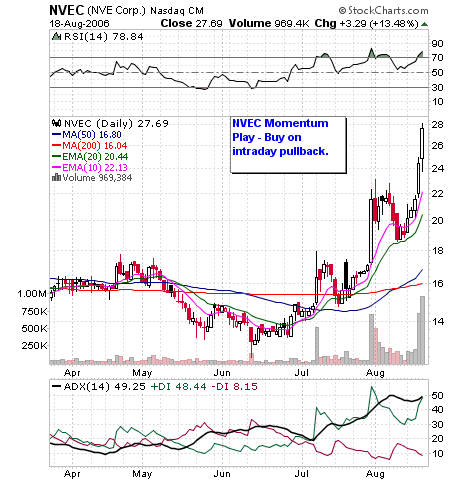 I caught a bit of the NVEC move Friday afternoon on an intraday scan. I'd like to see it pullback to $26.30 so I can get back in. This is a momentum play and should be good for more after some consolidation. I will be watching it closely going foward.
Other Bullish Watch List Stocks - RIMM, GENZ, NVDA. I'm also adding BRCM which, although not trading above its 200 MA, has made a nice rounded bottom and is consolidating recent gains.