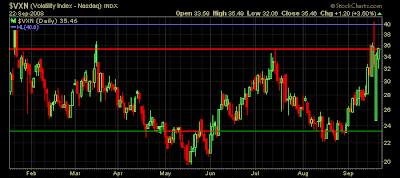
 The VIX and VXN measure market volatility for the S&P and NASDAQ respectfully. Volatility increases with fear or market declines. It is very rare to see extremely high volatility during periods of market euphoria. Last week's extreme readings tested highs previously recorded during the TECH bubble meltdown in 2002.
It's probably a good idea to review these charts regularly along with other key market indicators in order to have a good feel for the market and have an expectation for the short-term.

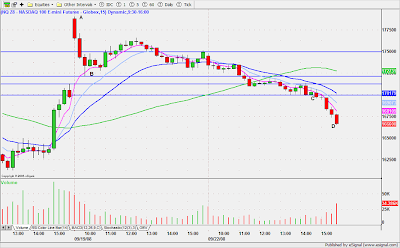
 The next two charts are the intraday 15 min. charts for the E-mini Nasdaq futures versus the VXN. As you can see, we have inverse relationships. On Friday when the market gapped up and faded (pts. A-B), the VXN did the inverse, gapped down and faded. EOD today, the market sold off (pts. C-D) and the VXN, broke out of its narrow trading range and rallied.
The intraday action on the market can be confirmed by looking for an inverse action on the VIX/VXN.

1 comment:
Thanks Jamie for your response. Really appreciate it.
Post a Comment