Thursday, February 28, 2008

Dummy Gapper Trade of the Day - Canadian Natural Resource Ltd (USA) (Public, NYSE:CNQ)

CNQ gapped up and held the daily pivot high from the last two sessions on a closing basis as it consolidated the gap sideways. It printed a series of higher lows. The fifth bar was NR7 and finally, it carved out a perfect green hammer which closed at the base of all those inside bars. I entered long and it started out perfectly then consolidated sideways again like a stair step pattern, before the next leg up. I took a partial at the 50% Fib. extension of the previous day low to the ORH. It extended 100% before retracing - Sweet!


I had high hopes for AAPL going into the session, but was not inspired by the early price action. I took a second look after Anarco mentioned it. Long on break of $130.00. Partial after 3 consecutive full green sticks. Stopped out on balance at $31.50.


ACOR and SIGM - two focus list names mentioned in the comments last night. ACOR was a H&S top on the daily. SIGM was a trendline breach followed by NRIB. I exited as price approached my target of $29.75 which is a long-term pivot point on the daily.

A really good day!

Wednesday, February 27, 2008

Trade of the Day - Arch Coal, Inc. (Public, NYSE:ACI)

Talked about this ACI setup in the comments last night. Yesterday's failed B&B BO could result in a breakdown.

Here's my trade on the 5 min.

I was watching ESRX for a C&H pattern yesterday afternoon but it didn't pan out. This morning my alert went off. But I didn't react quickly enough.

Just managed a scalp.


My gapper trade started off nicely. Thought it might form a C&H when it stalled, but it retraced too deeply.


Interesting little video on GOOG

Tuesday, February 26, 2008

Dummy Base & Break - Hansen Natural Corporation (Public, NASDAQ:HANS)

HANS was a B&B at the intra day I took a partial as price consolidated above R1 and exited balance as price approached R2.


The 5 min. time frame below shows a low risk short following shooting star on 15 min. I love making the same money twice.


DO was an HCPG pick from last night's newsletter. I missed the actual breakout, but managed to get in on part of the move as price consolidated. Intra day pivots had been cleared by the time I entered.

TEX consolidation above R1 leading to a sprint to R2.
GRMN was a failed C&H pattern. I'm sure this one would have worked if not for Fed Speak by Mr. Poole. Every time he opens his mouth it's time to get out of the market.


Dummy Gapper Trade of the Day - Foster Wheeler Ltd. (Public, NASDAQ:FWLT)

If you miss the big move, sometimes you get lucky with a NR consolidation and a nudge from the 5 period ema. Exit after 3 WRBs.


MarketClub Education Page Click Here

Monday, February 25, 2008

Cup & Handle - Alpha Natural Resources, Inc. (Public, NYSE:ANR)

ANR gapped down on the open and shortly after swooned towards recent lows. It promptly reversed after tagging $39.50 and then carved out a a choppy handle as part of a C&H pattern. My target was 100% Fibonacci extension from the low of the cup to the base of the handle. Some may argue that the base of the handle is in line with ORH, in which case I entered on a base break within the bigger base.

Price stalled just 15 cents shy of the target after filling the opening gap. I took a partial and watched price retrace sharply. I moved my stop to the reaction low and waited to see what would happen. I closed the position when price reached the target and tested its all time high.

A while later, I re-entered as it became obvious that ANR wasn't finished.

I've been watching MDR for a few days, waiting for a B&B above the blue line. Finally, mid-morning it carved out 2 inside bars at the base.


Sunday, February 24, 2008

Mail Bag - DryShips Inc. (Public, NASDAQ:DRYS)

A reader submitted this trade from Friday as depicted in the chart below. He was targeting S1 on break of 2 inside bars (NR7). "I was in the money but didn't book any hoping that it would at least test S1 at 82.50. I have a hard time telling when to book profit or let it trade. Your advice is always greatly appreciated."

The chart above maps out the areas of support and resistance. There's no obvious PP that stands out, but it's important to know where S/R levels are as well as the intraday PPs because they don't always line up.

In the early going, support turned into resistance as price based below, but could not take back the upper blue line. Two inside bars (NR7) is a common setup on this blog, but it is important to distinguish 2 inside versus NRIBs. These are not narrow range bars, even the NR7 bar is not narrow, but given what has preceded, it is the narrowest of the last seven bars. NRIBs are more powerful than regular inside bars.

The last chart is a 5 minute time frame and the point I want to highlight here is the wide swings in price leading into the trade. This is not a high quality setup despite the inside bars. After breaking out, DRYS carves out three consecutive 5 min. red bars with lower shadows, the third of which is a hammer-like. The high of the hammer bar is a whole number -$84.00. After taking out $84.00 by almost 50 cents, you have to protect that whole dollar level and plan to book some profits if the hammer initiates a reversal.

Friday, February 22, 2008

Dummy Trade of the Day - priceline.com Incorporated (Public, NASDAQ:PCLN)

PCLN made a decisive move lower off of the open. 4/15 was shaping up to be a NRIB so I drilled down to the 5 minute and saw a few NRIBs with consecutive lower highs. Partial as price approached $123 and exit balance on a bounce back to $124.

I could have taken a long after the stop out, but I had no idea it would retrace 50% in today's market. Notice the low volume on the retrace.

Wednesday, February 20, 2008

NASDAQ Technical Picture - Lower Trendline Holding


The NASDAQ dropped in opening trade due to higher than expected CPI inflation data. Both the Nasdaq Comp and Dow held near trendline support off the Jan-Feb lows. Narrow range trade dominated in the early going followed by a range BO triggering some midday follow through into positive territory. Choppy trade leading into the FOMC minutes was resolved with new session highs despite the Fed cutting its GDP forecast and raising its inflation and jobless forecasts.

Companies moving in after hours trading in reaction to earnings: Trading Up: LOCM +9.8%; NTES +7.0%; ITRI +6.8%; TEX +6.4%; SNPS +6.2%; IFSIA +6.0%; GA +4.2%; FADV +3.8%; ADI +3.5%; PLLL +2.3; TQNT +2.3%; TRN +1.9%; AEL +1.5%; ACTL +1.3%... Trading Down: LAD -19.9%; NVTL -18.1%; MSSR -17.7%; ATX -9.5%; OCNW -7.6%; CECO -7.1%; OII -7.0%; LNET -6.9%; MCRI -6.9%; VRGY -6.6%; PSYS -5.0%; LFG -3.1%; LGND -1.8%; GRT -1.3%... Companies moving in after hours trading in reaction to news: Trading Up: BNVI +33.9% (announces "positive developments" in on-going Phase 1/2 cancer drug trial); SQNM +6.5% (announces key milestone in development of noninvasive prenatal down syndrome test); IVAC +3.9% (receives orders for five 200 Lean magnetic disk sputtering systems for delivery in 2008); FTEK +2.6% (announces two Fuel Chem orders); IDGR +2.4% (enters into merger agreement to be acquired by an affiliate of Platinum Equity Advisors, LLC; IDGR stockholders to receive $10.30 per share); CPST +1.9% (receives another order in the oil & gas market)... Trading Down: SSRX -23.5% (reports Q4 results below consensus, issues downside FY08 rev guidance; discusses postponed original schedule of completing all three current Phase III trials by end of 2007); CIR -3.2% (announces Bill Higgins elected as CEO and Director); TTEC -2.5% (announces audit committee completes review of equity-based compensation practices with no evidence of improper conduct); DMND -1.8% (reaffims FY08 EPS in-line with consensus, says FY08 revs growth will be less than expected; sees Q2 EPS in-line, revs below); CBE -1.4% (announces its Cannon demand management solution selected by Baltimore Gas and Electric); TIN -1.1% (Carl Icahn amends 13D; reports the sale and purchase of call options); CR -1.1% (reaffirms FY08 guidance); TBSI -1.0% (takes delivery of handysize bulk carrier, M.V. Mohave Maiden for $26.0 mln); ABK -0.80% (U.K. Subisidiary insturucts the Association of British Insurers to conduct an initial holdings enquiry for the Metro Rail SSL & BCV bonds).

Dummy Gapper Missed Trade - Garmin Ltd. (Public, NASDAQ:GRMN)

I was focused on stocks gapping down so I missed this setup on GRMN. Hope some of you got involved. Just wanted to post this chart so I can have it for future reference.

JASO was a failed bear flag pattern. Price breaks out and then flattens out due to lack of volume and prints a couple of hammers so I exited. That was a good thing, otherwise I would have been stopped out as it took off on a momo move to the upside.

The bull flag near EOD moved like a flag pattern should.

After a period of very low volume, ACI moved above all three MAs and I felt like it would at least test the PP (first blue line). It did considerably more than that and by late in the session, it was testing last week's highs.

Tuesday, February 19, 2008

Dummy Trade of the Day - Hansen Natural Corporation (Public, NASDAQ:HANS)


HANS from the WL, gapped up and carved out a mini C&H pattern on the 5 min. timeframe. An uptick in volume as price broke out soon waned and gave way to higher volume on red bars. I had a feeling that it would fail due to lack of follow-thru and tightened the stop to avoid a bigger loss.

From failures come fast moves in the opposite direction, or so they say. This failure resulted in a slow move, which eventually set up a B&B short below the blue line and under all three MAs. If you missed that move, you could have easily entered on the bear flag pattern which formed near the ORL. The red line segments are how I trailed my stop. I exited the trade as price approached $41.00 on a surge in volume which foreshadowed the end of the move. I also took a long entry near the end of the session.

Monday, February 18, 2008

Sunday, February 17, 2008

Narrow Range Inside Bars (NRIB) Revisited

A reader submits:

Assuming all things constant and taking this illustration very simply (ignoring PP, MA, candlestick, etc), I appreciate your advice on whether my entry (dotted blue) would be correct. I also have 2 scenarios which I don't know how to deal with.

Just to clarify, when you talk about 2 NRIBs, does the 2nd NRIB have to be inside the 1st NRIB as well?


The two easiest scenarios to address are i) and v). These are excellent setups assuming that price is above and, in very close proximity to the 5 period ema. It's also of utmost importance that volume contracts during the inside bars. Refer to my initial post on the topic. Item v) addresses the last point in that the second IB does not have to be inside the first.

Items ii) and iii) are a little more subjective and may require more confirmation. For example, if ii) is part of a flat base, I would wait until price takes out the first bar or the shadows as may be the case. If bar 3 is red, I wouldn't take the entry off of this time frame. I would drill down and look for a candlestick reversal pattern on a lower time frame. The RIMM example below, although not exactly as depicted in the chart above is somewhat similar and makes the point.

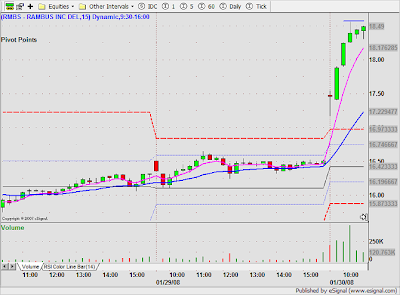
The first chart is the 15 min. and the second is the 5. See how the lower timeframe provides clarity as to what is really going on, whereas the 15 minute chart is somewhat ambiguous.


Item iii) is a good example of a triangle formation and if that is in fact what it looks like on the lower time frame, then this is the correct entry. If bar 1 is the OR and there is no resistance above including an intra day PP, then I would trade it as presented in the example. The only caveat is that until the ORH is taken out, there's always a risk. So if the ORH is only pennies away, I sometimes wait for confirmation. On the other hand, if the 2nd IB is NR7, the setup becomes all that more powerful and may not require confirmation. If you take the entry as presented, you generally have enough room to exit at or near BE if the pattern fails. It's a judgment call and you will determine which entry suits your trading style best over time.

Item vi) is a bullish flag or flag pole and should be entered on break of the flag. When drawing the line segment for the flag make sure to include the upper shadows.

Item iv) is subjective again. I often wait until price takes out bar 1 because the 5 period ema is too far away and I'm waiting for it to catch up to price. This pattern often comes up in the handle portion of the C&H pattern, and here again, I wait until price takes out bar 1. That's my personal preference and it saves me from taking trades that don't pan out, or reverse just prior to breaking out.

Here is an example of a trade with RMBS that I took a while back which depicts the same formation as item iv). As you can see from the first 15 minute chart, the 5 period ema was still quite a distance from price, so I set my buy stop order above the outside bar.


If the inside bars set up at the base of a PP or at a resistance level (for long entries as depicted above), a successful break will generally result in a big move. The best setups are the ones that give consecutive higher lows, so in that respect I prefer i), iii), and v), everything else being equal.

MarketClub Education Page Click Here

Friday, February 15, 2008

Dummy Gapper Trade of the Day - Arch Coal, Inc. (Public, NYSE:ACI)

ACI from the Briefing.com gapper list, was an analyst downgrade. The first chart is the daily chart with pivot point. In analyzing the setup, I surmised that the 20 day EMA was a suitable target because there was no support between it and the daily pivot.

The next chart is the 15 minute time frame which started to look very interesting as price and the down sloping 5 period EMA started coming together. There was a clear bear flag developing at the base of the daily PP (blue line). IMO, the best setups take place at, or very near their pivot points/support/resistance levels. However, because bulls and bears defend these levels, we have to be especially cautious of the head fakes.

The last chart is the 5 minute time frame which shows my entries, initial stops, and exits. Short on break of the bear flag with a partial as price approaches the ORL. After the partial I tightened my stop to $49.00 to give it a little room. Price consolidated sideways for an hour or so before the last swoon towards my target (lower blue line). The volume spike on that last leg lower foreshadows the end of the move.

As you can see from the charts, ACI carved out a bullish tweezer bottom at the target which kept me interested in a possible retracement trade. A while later it printed a perfect green hammer on the 15 and a B&B setup on the 5 min. I took the B&B long and set my prelim target at the down sloping 20 EMA on the 15 minute time frame. The 5 min. printed 3 WRBs as price rallied into the target. I placed a BE stop on the balance and waited to see if the 20 EMA would hold as resistance. After a retrace, price continued higher, eventually reaching the original BO point.

It doesn't get much better than this as far as symmetry is concerned. Study these charts for future reference and have a great long weekend!


Finding the Daily Pivot Point


In response to 00NR7, here is a chart that shows how I find the daily PP.

Click on the chart to enlarge


Thursday, February 14, 2008

Dummy Gapper Trade of the Day - Network Appliance, Inc. (Public, NASDAQ:NTAP)


NTAP a gapper from the Briefing.com list, set up nicely on a break of inside bar (actual entry looks better on the 5 minute time frame). I was hoping for 3 WRBs but after easily taking out the ORL, it paused to consolidate at the 25% Fib. extension of the previous day high to the ORL. I took a partial as price tagged the target. I had to give the second half a really wide stop after the bullish reversal from the morning swing low.

When it retests the lows it's going to bounce because everyone who held through lunch, like me is happy to get out with initial profits still intact. At the end of the day it didn't extend much beyond the initial swoon lower.

NVDA was an earnings gap. After consolidating the early run, it set up a dummy short on the break of the daily pivot.

NASDAQ Technical Picture - Tech Provides Leadership


Tech provided leadership on the heels of better earnings from Semi +3% (AMAT +10.1%) which carried over to other related sectors such as Computer-Hardware +3.2%, Networking +3.2%, Internet +2.9%, Disk Drive +2.7%, Software +2.1%.

We have now crossed above the lower base/pivot and are in the process of closing the gap from last week. Let's see if we can hang on to the recovery of the 20 day EMA as we approach the next PP level. Although, it's too soon to tell, it looks like we could be in the process of developing an ascending triangle.

The McClellan oscillator is in the overbought zone, so we may have to work it off with some consolidative/corrective action near-term.

Companies moving in after hours trading in reaction to earnings: Trading Up: AMKR +13.3%; PPO +10.0%; CCRT +9.5%; STEN +8.6%; AERO +8.0%; HIMX +6.9%; GNK +6.0%; VCLK +5.2%; RMKR +4.9%; BIDU +6.5%; JLN +4.2%; SKX +3.4%; IPAS +1.7%; KAI +1.5%... Trading Down: MDRX -13.6%; NHWK -12.3%; XFML -10.9%; NTGR -10.3%; HPY -8.3%; EQIX -7.2%; STMP -7.0%; DENN -6.8%; AAP -5.5%; TTGT -5.1%; DVA -4.8%; ZGEN -4.3%; IM -4.3%; GSIC -2.9%; NTAP -2.8%; SMMX -2.0%; TWPG -1.8%; LPSN -1.8%; AEA -1.6%; MOH -1.4%; EGP -1.0%... Companies moving in after hours trading in reaction to news: Trading Up: VCLK +5.6% (announces settlement with the FTC; agrees to pay a settlement of $2.9 mil); CCU +4.3% (DOJ says Clear Channel must sell stations to win deal approval -- DJ); MBI +4.0% (Completes $1 bln common stock offering; increases claims-paying resources by more than $3 bln since inception of capital strengthening plan); WPI +2.7% (announces FDA inspection of Florida facilities); CEPH +1.5% (gives statement on Federal Trade Commission action regarding PROVIGIL patent settlements); ACXM +1.0% (announces increase in stock repurchase program by $25 mln); CEPH +1.0% (FTC says Cephalon illegally delayed generic rivals vs Provigil -- WSJ)... Trading Down: NHWK -12.3% (announces departure of Tim Mayleben, President and COO and the departure of Senior VP and CFO Glenn Cole); COIN -9.7% (files an S-3 related to 750k share common stock offering by selling shareholders); BELM -1.0% (announces receipt of waivers from its major lenders); TYG -1.1% (announces commencement of common stock offering of ~1.5 mln shares). Courtesy of Briefing.com

Wednesday, February 13, 2008

Dummy Trade of the Day - TBS International Limited (Public, NASDAQ:TBSI)

TBSI set up a NRIB (NR7) at the base of the ORH in close proximity to the rising 5 period ema. I took a partial at R1 and exited the balance as price approached the whole $ number $36.00.

NVDA carved out 2 inside bars on declining volume at the base of yesterday's pivot high. Long on a break of the second bar high. Sometimes when I trade lower dollar value stocks I lose perspective with respect to candlestick range. The second inside bar has a range of 20 cents and I'm thinking NRIB, but it's not. The point is a NRIB is much more powerful than a regular inside bar, everything else being equal.

Eventually NVDA carved out a C&H pattern and I used the Fib extension of the ORL to the base of the handle to gauge my target. Again, after the C&H BO, it prints 3 NRBs as the 5 ema catches up to price and that seems to provide the coiled spring effect to boost this thing into price expansion. I took a partial as price approached R2 and exited the balance near the 100% Fib. extension.

Tuesday, February 12, 2008

Dummy Trade of the Day - Research In Motion Limited (USA) (NASDAQ: RIMM)

Shorted RIMM in the same area as yesterday's long (blue line). After breaching the blue line, RIMM recovered it, but not for long. A red hanging man foreshadowed further weakness and I waited for confirmation before shorting just in time for the late day swoon.

NVDA was a pivot point trade off of an inside bar. It got off to a great start but retraced sharply before making its way back up and eventually tagging the PP. The daily chart below shows where I get the PPs from. The target was derived from January's early swing low.