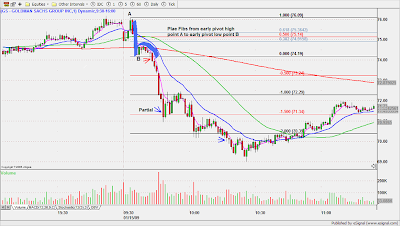
 Shorting the h refers to a pattern which forms on the 1 minute chart after a weak open - usually 3 consecutive lower closes followed by a shallow retracement which has a rounded form. The pattern has a distinct h look to it. I first saw this pattern in action on Anarco's blog a few months ago. I read about it again just recently, but I can't remember where.
Today we had weak banking stocks due to some worries over BAC so I decided to have a look at GS as a sympathy play. Price quickly tested yesterday's lows so I plotted my fibs from the early pivot high (A) to the early pivot low (B). Price tried to retrace but couldn't break above the 38% level and slowly moved back to the pivot low forming an h pattern.
My primary target was $70.00 from the 15 minute chart above, but I wanted to take some off if price stalled. For a while I thought it was going straight down but after the first big volume spike I was on notice that it would soon capitulate. Took a partial 150% at exit balance at the $70.00 round number.

 Susan asks in reference to yesterday's NQ futures trade:
In the Nasdaq future example of Jan. 14, it opened near the PDL and then moved downward. The fib. lines are drawn from PDH-PDL. How to draw fib. lines when price opens inside the previous day range, away from PDL and then breaks the PDL and closes weak - example: V, BUCY from Jan. 15 trade.
From the 15 minute chart below we see that the 15 minute OR opens within the previous day's trading range, but closes below it. We still plot fibs. from PDH to PDL because it's the opening tick that determines fib. placement Trader-X guidelines
The first bar is really weak and almost tags the 50% fib. level. The next bar is narrow and barely retraces the OR real body. This is very bearish.
 On the 1 minute chart we also see a smaller h formation.
 Volatility is much lower now than we were used to in Q4 2008. So when the S&P tested the December lows, it set off a technical bounce, but I wasn't really feeling it. Volume was lame and it took me a while to react. Anyway, I decided to take a position in the NASDAQ futures when they retested the PDL.
On a technical bounce I prefer to use intraday pivots as opposed to Fibs. The pivots are wider and I'm less likely to partial out too soon. After the partial at P, I expected price to consolidate sideways until it came back to the trendline, but it just kept chopping higher.

6 comments:
Thanks Jamie for clearing my fib. queries. Really appreciate your response.
h pattern was the first pattern that I started trading and I still trade this one.
Susan
Susan,
Yeah, h pattern has legs. Other Alphabet soup patterns I like are W(bullish) and M(bearish).
I trade the M pattern more than W. What is your criteria for taking the M trade?
Susan
Another great post Jamie!!!
I am focused on the 5 and 15 min charts these days and for some reason I am not seeing so many h patterns in the 5min charts (as I saw on the 3 qt last year), but I always have the 1 min chart open and when I see the h pattern there I take it as hint that the down trend will continue.
Cheers!
Susan.
I trade more W, but criteria is just slightly different from h because two pivots required for both patterns, but BTU is a good example this morning. Ext. pivots from highest point for M and lowest for W.
Thanks Anarco,
Yeah, much easier to spot on the lower timeframe than 5. In early trade I'm really focused on 15 min. OR and 1 minute chart.
Post a Comment