 The CRB commoities index DBC chart above, fell 17 pts. (the most in 2 years) almost 7% on huge volume today. No commodity escaped the selling. Gold lost $40 (3%) while silver lost another 10%. Crude oil fell $12 (10%). Copper lost 4%. Part of the reason for the heavy commodity selling was a sharp rebound in the U.S. Dollar. Look at a chart of UUP and you'll see a huge move up on massive volume. Most of the dollar strength came from a falling Euro which tumbled 2% on the ECB suggestion the next rate hike was being postponed. The breakdown in commodities (and copper in particular) is especially troubling since it suggests that the global economy is slowing. That may also explain why bonds are rallying and stocks are correcting around the globe.
Furthermore, sector rotation over the past weeks suggests a move into biotech/healthcare, consumer discretionary, and utilities, all defensive sectors, which could indicate a near-term market peak.
The S&P is still on a path of lower highs and lower lows as depicted on the 60 min. chart below. The first support level held in early trade, and a nice rally ensued. We moved to the upper channel line, consolidated and then plunged, carving out another lower low. If the S&P doesn't turn around tomorrow, we'll have a failed pattern IMO. Inverse H&S pattern broke out, came back for a retest and failed.
Job data tomorrow in pre-market.
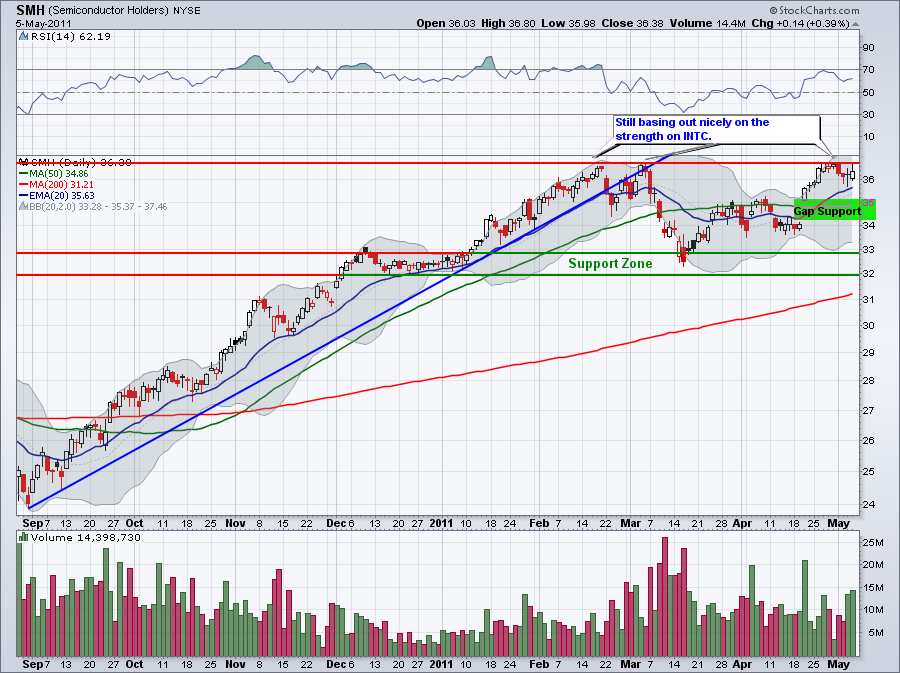
 The NASDAQ is holding up well so far. The SMH is still basing out, but the biggest holding in the SMH is INTC which has been vertical since reporting earnings two weeks ago. Not sure the other components of the SMH are really strong enough to propel this sector higher.
 We've been talking about an oversold technical bounce in the $USD for a while now, so today's move is no surprise.
 Oil prices back under $100.00. Smart money trade of the day was short USO because oil futures (CL_F) were bear flagging in pre-market.
 Just when many thought, it couldn't go much lower, it gaps down and rips lower on higher volume. SLV has given back three months gains in one week. Next supports are $33.00 and $30.00.
 I'd like to see SLV gap well below it's lower trend channel line and then bounce. Today's gap down was well within the channel, so no trade. I tried some long when it capitulated into the lower channel line on a huge volume spike, but it didn't end well. A lot of aggravation for a scratch trade.
If you're hurting yourself trying to pick a bottom in SLV, it's not worth it. Margin requirements are being increased frequently and every increase is another leg down. When you see a bonafide short covering rally, you'll know it and you can jump in.

7 comments:
Jamie,
Can you pls. explain how to use Bollinger Bands?
Thanks
Jamie,
great trading on your part as always. I know you are using Trade Ideas in finding good trading candidates during the day. Is it possible to share what pre-defined scans you normally use? I hope this is not asked too much ;-)
Greatly looking forward to your answer as you have such a great impact on my trading and I hope to further learn from you!
Thanks a lot for everything!!!
T
and keep the great trades coming ;-)
M
I will cover Bollinger Bands in a future post. I'm not an expert on the subject, but I do like to use them to identify stocks that are coiling ahead of expansion - narrow BB, and for stocks that are overbought and oversold - stocks expanding well above upper BB and below lower BB.
Timo,
I use some of the pre-defined scans and I modify them to reduce the number of hits to a manageable level.
Stocks up/down big in pre market trading. Here I add a min. price and min. avg. daily volume to ensure the scan meets my personal trading criteria.
Up/Down 50 cents or more in last 5 min. on volume spike. Same thing here add a min.price and daily volume filter to reduce the number of hits.
I have an NR7 15 min. scan for momentum names. Create gapper and stocks in play list for this scan. Do not want to scan the entire market for NR7.
I have a scan for stocks gapping $1 or more with 15 RSI > 60 for longs and 15 min. RSI < 40 for shorts.
I also use upside momentum scan.
I also have watch list scans, one each up/down for my 50 usual suspects list which includes pre and post market action.
Those are the scans I rely on the most.
Hope this helps.
Thanks a lot Jamie! Your helpfulness and willingness to share your wisdom and techniques is being greatly appreciated!!!
And yes indeed, it helps a lot ;-)
Keep up the great job and continue to rock this market!!!
Timo
Thanks Timo!
Post a Comment