
Sort the
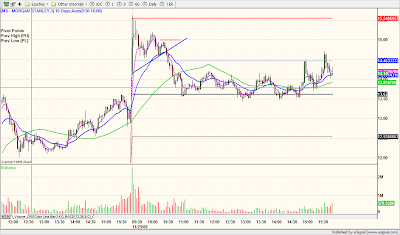
WL on % change and focus on the outliers. MS was in one of the top spots for the second day in row. This time, it got a little ahead of itself and set up an easy fade. The first chart is the 1 minute and the second is the 3 minute. The 3 min. has the
intraday pivot lines , as well as the the previous day high/lows mapped out. The picture is crystal clear with all those
tweezer tops at R2 off the open. Wait for the gap to consolidate and then short. The preliminary target was the previous day high, followed by a complete gap fill. The first target was reached easily, but the second didn't pan out. Once price failed to hold the
trendline, we sort of fell into a trading range.

After
CNQ tested and held its new
trendline on the 15 minute, it carved out an inverse H&S pattern on the 1 minute. Price made a vertical move into resistance (prelim. target). I expected that it would consolidate and notch a leg higher, but it just came crashing back down , so I had to scramble to get out.

 Sort the WL on % change and focus on the outliers. MS was in one of the top spots for the second day in row. This time, it got a little ahead of itself and set up an easy fade. The first chart is the 1 minute and the second is the 3 minute. The 3 min. has the intraday pivot lines , as well as the the previous day high/lows mapped out. The picture is crystal clear with all those tweezer tops at R2 off the open. Wait for the gap to consolidate and then short. The preliminary target was the previous day high, followed by a complete gap fill. The first target was reached easily, but the second didn't pan out. Once price failed to hold the trendline, we sort of fell into a trading range.
 After CNQ tested and held its new trendline on the 15 minute, it carved out an inverse H&S pattern on the 1 minute. Price made a vertical move into resistance (prelim. target). I expected that it would consolidate and notch a leg higher, but it just came crashing back down , so I had to scramble to get out.
7 comments:
Really nice to see how you used S/R and standard chart patterns. You prove that it doesn't have to be complicated.
Thanks for sharing the analysis. Great job.
-AT
Thanks AT,
I've really started to pay more attention to the basic chart patterns that develop on the 1 minute time frame since I started trading futures. It's a great way to fine tune the entries and exits.
That's a nice setup in MS. It has a descending triangle look and the rounded tops show a certain amount of orderliness. I'm adding MS to my watchlist. (I removed all the financials on my WL after the ban).
Rick,
Yeah, I have a number financials on the WL along with energy, gold, commodities, and tech. Think these are important sectors for a bounce here.
Not sure what's up with POT, a real disappointment as the markets bounce off the lows.
Nice trading Jamie! And great analysis too!
It may sound a bit silly, but when trading 1min charts, I find it hard sometimes to determine my stop loss. In the 5min and 15min it is most of the time the other end of the trigger bar, but on the 1min it is not always clear to me. For example, in your CNQ trade, what was the stop? The low of the right shoulder?
Or do you just enter without stop loss an move out right away if the action does not immediately confirm your setup?
Thanks in advance!
Anarco,
No it's doesn't sound silly at all. When trading chart patterns, on the 1 min. timeframe, it's important to put a stop below the shoulder or the handle. I've seen several failures of this particular pattern and when they fail, they rip in the opposite direction. So, also important not to anticipate and actually wait for the BO to occur.
Cheers!
Post a Comment